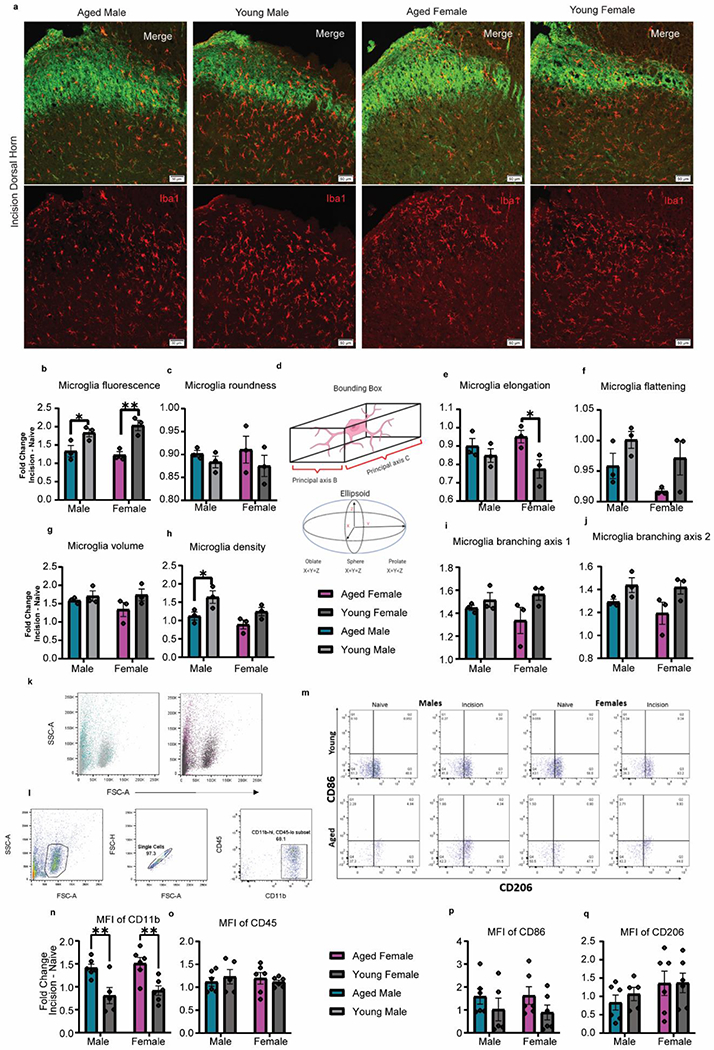
Fig. 6. Lumbar Spinal Cord Microglia Activation States.

a, Representative images from the 2-day post incision group showing the ipsilateral dorsal horn of the L4-6 lumbar spinal cord. Imaging of IBA1+ microglia in the superficial lamina was guided by non-peptidergic IB4+ neurons. Scale bar = 50μm. b, Graphic showing a representation of how principal axes and axes of symmetry of an ellipsoid are measured in a 3-D environment. c, Microglia fluorescence as measured by sum fluorescence normalized by area was increased in young animals, specifically in females. d, No differences were found in microglia roundness as measured by cell sphericity. e, Microglia elongation as measured by prolate ellipticity was increased in aged animals, specifically in females. f, A main effect of age was found in microglia flattening as measured by oblate ellipticity with young animals having flatter microglia. g, No differences were found in microglial volume. h, Microglia density as measured by microglia count normalized by area was increased in males and the young cohorts. i-j, While no differences were found in microglia branching axis 1, young animals showed increase branching in microglia branching axis 2. k. Representative dot plots of FSC x SSC for microglia from aged and young animals. l. Gating strategy for isolation of microglial populations. m. Representative dot plots of CD86 & CD206 populations. Mean fluorescence intensity (MFI) analysis of CD11b (n), CD45 (o), CD86 (p), and CD206 (q) expression after plantar incision, represented as fold change from naïve animals. Data are represented as mean ± SEM. Two-way ANOVA with post-hoc Bonferroni was used. *p<0.05, **p<0.01, ***p<0,001, ****p<0,0001.
