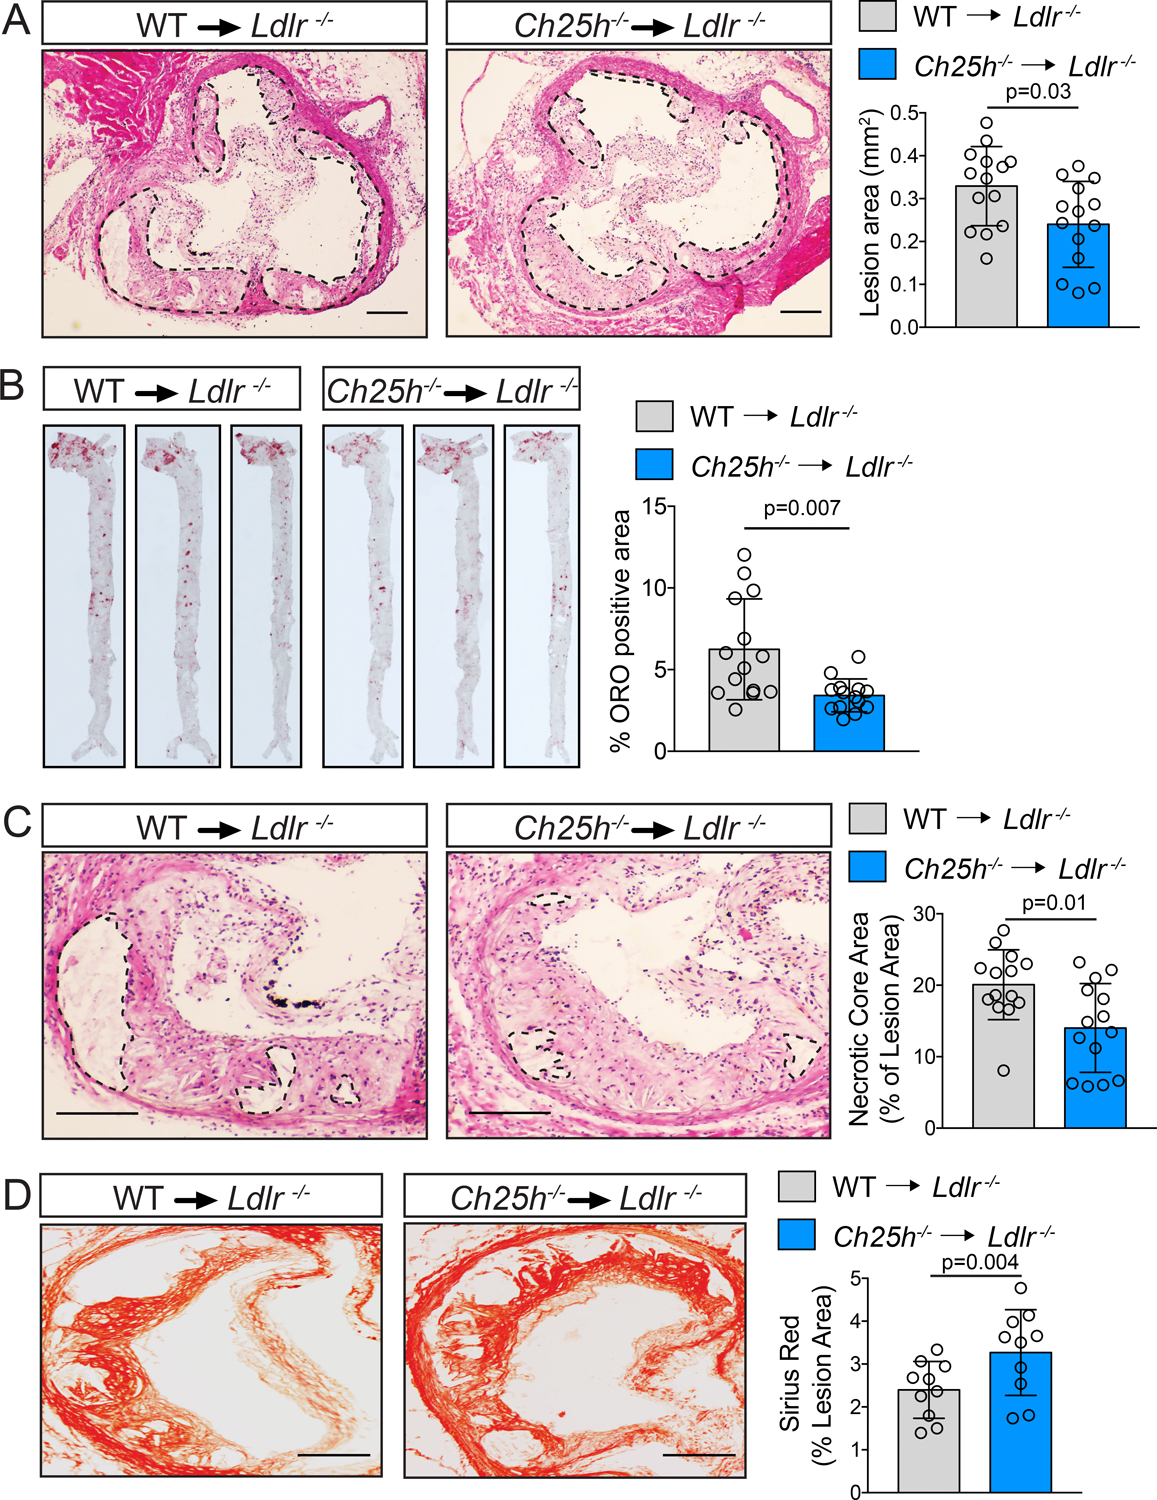
Figure 2. Ch25h deficiency in hematopoietic cells protects against atherosclerosis.

Analysis of Ldlr−/− mice transplanted with WT or Ch25h−/− bone marrow and fed for 12 weeks on a WD. A, C, Representative histological analysis of cross sections of the aortic sinus stained with hematoxylin and eosin (H&E). Dashed lines delimit the plaque area (A) and show the edge of the developing necrotic core (C). Quantification of plaque size (A) and necrotic core (C) are shown on the right panels (mean ±SD, n=14 mice per group). B, Representative en face ORO staining of aortas. Quantification of the ORO positive area is shown in the right panel and represents the mean ±SD (n=14 mice per group). D, Representative histological analysis of cross sections of the aortic sinus stained with Picrosirius Red. Quantification of the Picrosirius Red positive area is shown at the right panel and represents the mean ±SD (n=10 mice per group). All data were analyzed by Mann-Whitney non-parametric test. Scale bar: 100 μm.
