
Figure 5.
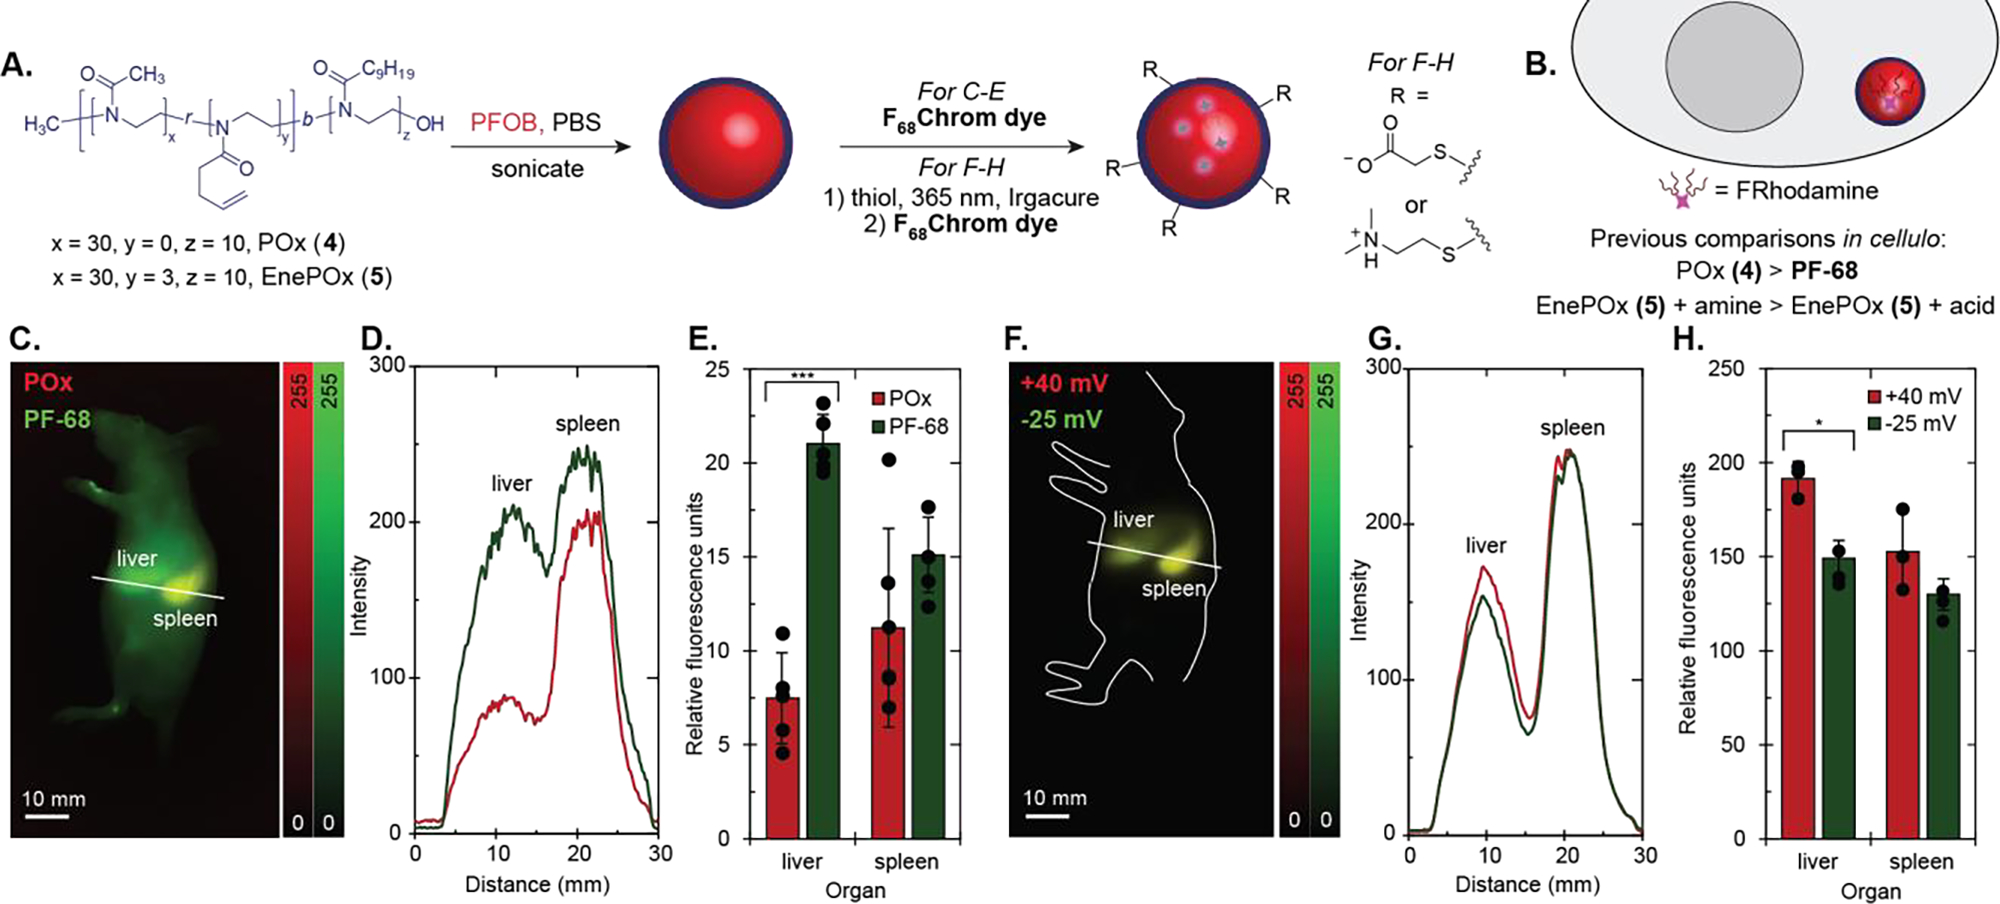
Imaging PFC nanoemulsions stabilized by poly(oxazoline) amphiphiles in vivo. A) Schematic of PFOB emulsions stabilized by POx (4) or EnePOx (5) at 2.7 wt% and subsequent functionalization of emulsions by thiol-ene chemistry. B) Summary of results from previous work in cellulo using this methodology. C) Two color sagittal image of an animal injected with Pluronic F-68 (PF-68)-stabilized emulsions and POx-stabilized emulsions, taken at 48 hours post-injection. F68Chrom7 ex. 974 nm, 100 mW/cm2; F68Chrom5 ex. 785 nm, 50 mW/cm2; 1100 nm LP, 5–7 ms ET). 100 μL of F68Chrom5-labelled PF-68 emulsions and 100 μL of F68Chrom7-labelled POx emulsions were i.v. injected into one animal. Scale bars = 10 mm. D) Cross-section intensity profile of the line drawn in 5C, where the green line represents the profile for PF-68 emulsions and the red line represents the profile for POx emulsions. E) Ex vivo images were captured after the 48 hour post-injection images. The mean fluorescence intensity from each organ was quantified using ImageJ, normalized to the lowest intensity organ value, and plotted. See Figure S11 for bar graph with all organs. Dots overlaid on bar graph are replicates. Error bars are the standard deviation of the mean, where n = 5. Red bars on the left indicate POx emulsions and green bars on the right indicate Pluronic F-68 emulsions. F) Two color sagittal image of an animal injected with EnePOx-stabilized emulsions, taken at 48 hours post-injection. 100 μL of F68Chrom5-labelled negatively charged (−25 mV) emulsions and 100 μL of F68Chrom7-labelled positively charged (+40 mV) emulsions were i.v. injected into one animal. Images were taken with the same settings as in 5C. Scale bars = 10 mm. G) Cross-section intensity profile of the line drawn in 5F, where the green line represents the profile for negatively charged emulsions and the red line represents the profile for positively charged emulsions. H) Ex vivo images were captured after the 48 hour post-injection images. The mean fluorescence intensity from each organ was quantified using the ImageJ measurement function, normalized to the lowest intensity organ value, and plotted. See Figure S13 for bar graph with all organs. Signal was normalized to the lowest intensity organ. Dots overlaid on bar graph are replicates. Red bars on the left indicate positively charged emulsions and green bars on the right indicate negatively charged emulsions. Error bars are the standard deviation of the mean, where n = 3. * = p < 0.05, *** = p < 0.001