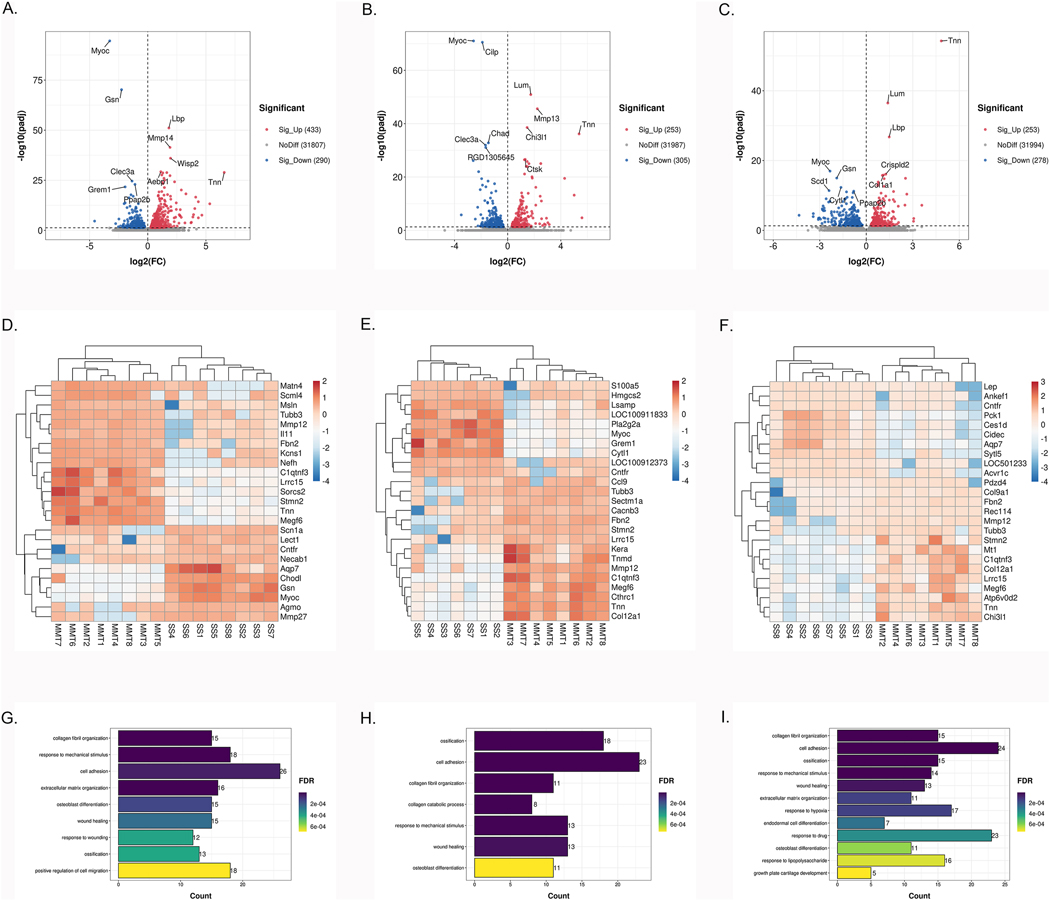
Fig. 3. DEGs and biological processes in meniscus between sham-operated and MMT-operated knees.
A-C: Volcano plot of genome-wide mRNA expression between two groups at 2 (A), 4 (B), 6 (C) weeks post-surgery (padj<0.05). D–F: Heatmap of 25 DEGs with the highest fold change in menisci at 2 (D), 4 (E), 6 (F) weeks post-surgery. G–I: The top biological processes for up-regulated DEGs between two groups at 2 (G), 4 (H), 6 (I) weeks post-surgery.

