

Abstract
Purpose:
To develop a free-breathing myocardial T1 mapping technique using inversion-recovery (IR) radial fast low-angle shot (FLASH) and calibrationless motion-resolved model-based reconstruction.
Methods:
Free-running (free-breathing, retrospective cardiac gating) IR radial FLASH is used for data acquisition at 3T. First, to reduce the waiting time between inversions, an analytical formula is derived that takes the incomplete T1 recovery into account for an accurate T1 calculation. Second, the respiratory motion signal is estimated from the k-space center of the contrast varying acquisition using an adapted singular spectrum analysis (SSA-FARY) technique. Third, a motion-resolved model-based reconstruction is used to estimate both parameter and coil sensitivity maps directly from the sorted k-space data. Thus, spatio-temporal total variation, in addition to the spatial sparsity constraints, can be directly applied to the parameter maps. Validations are performed on an experimental phantom, eleven human subjects, and a young landrace pig with myocardial infarction.
Results:
In comparison to an IR spin-echo reference, phantom results confirm good T1 accuracy, when reducing the waiting time from five seconds to one second using the new correction. The motion-resolved model-based reconstruction further improves T1 precision compared to the spatial regularization-only reconstruction. Aside from showing that a reliable respiratory motion signal can be estimated using modified SSA-FARY, in vivo studies demonstrate that dynamic myocardial T1 maps can be obtained within two minutes with good precision and repeatability.
Conclusion:
Motion-resolved myocardial T1 mapping during free-breathing with good accuracy, precision and repeatability can be achieved by combining inversion-recovery radial FLASH, self-gating and a calibrationless motion-resolved model-based reconstruction.
Keywords: free-breathing myocardial T1 mapping, self-gating, motion-resolved model-based reconstruction, radial FLASH, spatiotemporal total variation
Introduction
Quantitative myocardial T1 mapping is becoming ever more important in clinical cardiovascular magnetic resonance (CMR) imaging [1, 2]. For example, both native and post-contrast T1 mapping can be used to assess diffuse myocardial fibrosis [3]. Commonly used T1 mapping techniques are modified Look-Locker inversion recovery (MOLLI) [4], saturation recovery single-shot acquisition (SASHA) [5], and saturation pulse prepared heart rate independent inversion recovery (SAPPHIRE) [6]. These techniques normally utilize a breathhold to mitigate respiratory motion and use an external electrocardiogram (ECG) device to synchronize data acquisition to a certain cardiac phase (e.g., end-diastolic), reducing the influence of cardiac motion. Although widely used, the need of a breathhold time of around 11 to 17 heartbeats may cause discomfort for patients (such as heart failure patients) and limits the achievable spatial resolution. Substantial efforts were made to shorten the breathhold period by optimized sampling [7], or by using non-Cartesian acquisition for single-shot myocardial T1 mapping [8–10] or by cardiac magnetic resonance fingerprinting (MRF) techniques for efficient multi-parameter mapping [11–14]. More recently, free-breathing strategies [15–19] were investigated. These approaches acquire data continuously without the need for breath-holding and extract motion (respiration and/or cardiac) signals from the measured data itself using self-gating techniques. Following motion-resolved image reconstruction and pixel-wise fitting/matching, cardiac T1 maps can then be obtained for certain motion states.
Model-based reconstruction [20–22] is an alternative approach to quantitative MRI. These methods directly reconstruct parameter maps from k-space, substantially reducing the number of unknowns to the number of actual physical parameters by not first reconstructing contrast-weighted images. They also offer a flexible choice of temporal footprint for parameter quantification as no intermediate image reconstruction is needed. Furthermore, sparsity constraints can be applied directly to the parameter maps to improve precision [23–25]. Model-based approaches have been used to accelerate myocardial T1 mapping at high spatial resolution [26, 27], but still require breath-holding.
Combining idea from all these strategies, we aim to develop a free-breathing myocardial T1 mapping technique by combining a free-running inversion-prepared radial FLASH sequence, an adapted self-gating technique and a calibrationless motion-resolved model-based reconstruction. In particular, the techniques integrate three novel developments: First, instead of setting the delay long enough to allow for a full T1 recovery (> 5 s), we have derived an analytical formula for accurate T1 calculation even when T1 recovery is incomplete, i.e., ≤ 3 s. Second, to allow for robust respiratory motion estimation, we propose to use an extended technique based on SSA-FARY [28] to extract the respiratory motion signal from the k-space center by eliminating the trajectory-dependent oscillations and inversion contrast in a preprocessing step. Third, after sorting raw data into a number of respiration and cardiac bins based on the estimated respiration signal and the recorded ECG signal, we estimate both parameter maps and coil sensitivity maps of the desired motion bins directly from k-space using a calibrationless motion-resolved model-based reconstruction. The latter is an extension of a previously developed model-based reconstruction [24, 27] to the motion-resolved case which enables the application of sparsity constraints along all motion dimensions, in addition to the spatial regularization, to further improve T1 precision. Validation of the proposed method was performed on an experimental phantom, eleven healthy subjects and one landrace pig with infarcted myocardium.
Theory
Sequence Design and T1 Estimation from Incomplete Recovery
The free-running T1 mapping sequence (free-breathing, retrospective cardiac gating) is shown in Figure 1 (A). It consists of three repeated blocks: (1) non-selective inversion (2) continuous radial FLASH readout using a tiny golden-angle (≈ 23.63°) [29] with a 3-s duration (3) and a time delay (T1 recovery) before the inversion in the next repetition. In previous studies using multiple inversions [30, 31], the delay time was set long enough to ensure full recovery of longitudinal magnetization so that T1 can still be calculated using the conventional Look-Locker formula [32, 33]. However, a full recovery may need as long as 5 seconds for cardiac T1 mapping, which prolongs the total acquisition time. In this work, we treat this delay as a period that encodes T1 information in the data. We use an analytical formula based on T1, T1*, the steady-state signal Mss, and the new start magnetization signal (i.e., in the case that the T1 recovery is not complete:, with M0 the equilibrium magnetization):
| (1) |
where , , R1 = 1/T1, and t1, t1s are the time periods for T1 and T1* relaxation, respectively. Thus, T1 can be estimated even from partial T1 recoveries after reconstruction of the parameter maps according to Equation (1). Here, we adopt a bisection root-finding algorithm to solve Equation (1). A full derivation of the above equation can be found in Section I of the Supporting Information File.
Figure 1.
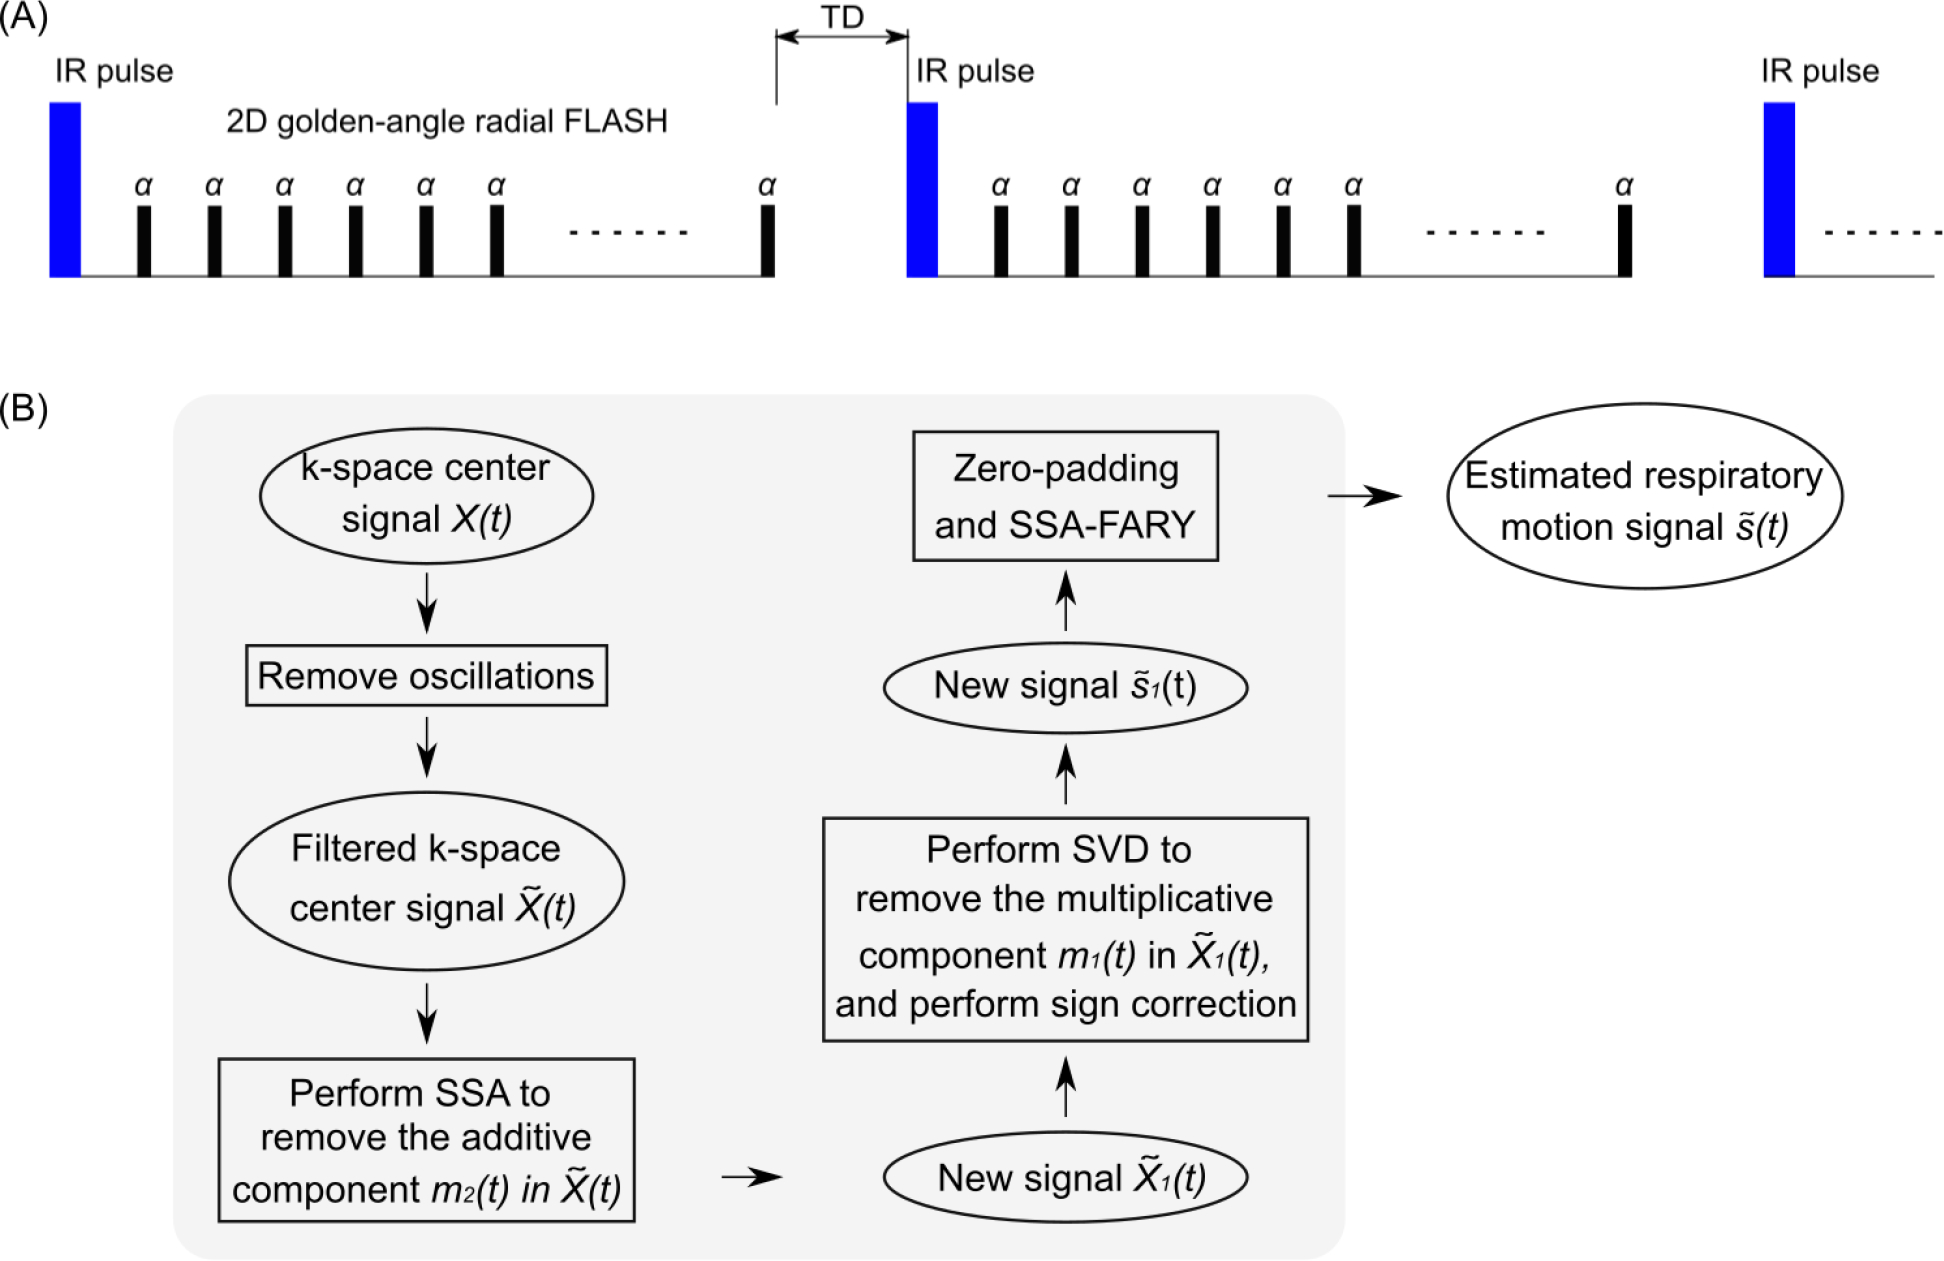
A. Schematic diagram of the free-running inversion-recovery radial FLASH sequence. Note TD is the delay time between inversions and this period encodes pure T1 information in the data. B. Flowchart of the main steps in the adapted SSA-FARY technique for the respiratory motion signal estimation from the k-space center.
Respiratory Motion Estimation
The main steps of the respiratory motion estimation process are demonstrated in the flowchart in Figure 1 (B). In the following, we explain all these steps in detail. Similar to [28, 34], we construct an auto-calibration (AC) region for self-gating using the central k-space samples of a radial acquisition, resulting in a time-series X(t) of size [NC × Nt], with NC and Nt the total number of channels (phased array coils) and central k-space points, respectively. Nt = NS · NI, with NS the number of sampling points per IR and NI the total number of inversions. The AC data is usually corrupted by a trajectory-dependent signal due to eddy currents. Therefore, we first remove such oscillations by extending the method of orthogonal projections (with higher-order harmonics) from the steady-state case [28] to the contrast-change case (inversion recovery). Details of this procedure can be found in the Section II of the Supporting Information File.
Following removal of the oscillations, the new k-space center signal can be modeled as
| (2) |
with s(t) the steady-state signal which contains motion information (ideally without contrast change), and m1(t) and m2(t) the multiplicative and additive signals which model the contrast change due to inversion [35]. Here we propose the following procedure to remove the main effects from the changing contrast and to extract the signal component that is most relevant for respiratory motion:
Step 1. Estimating m2(t): Perform the singular spectrum analysis (SSA) on , remove the components that are mostly related to the inversion-recovery contrast in the spectrum domain and transfer the processed signal back to the time domain. In SSA [28], this step largely removes the additive contrast-changing component of Equation (2), resulting in a new signal , with the estimated additive contrast-changing signal.
- Step 2. Estimating m1(t): Since the multiplicative component is mainly left in Equation (2), the singular value decomposition (SVD) is then performed on and the corresponding rank-one approximation is taken, generating an estimate of the multiplicative component . Next, the magnitude of was utilized for the calculation, leading to a new signal . Due to the 180° phase difference before and after zero-crossing caused by inversion, the phase of before zero-crossing needs to be inverted. This was done by first detecting the minimum points of the absolute value of signal (zero-crossing) for each coil and inversion and then correcting using:
(3) Step 3. Zero-padding: To account for the missing temporal information due to the delay time between inversions, was zero-padded, generating a new signal with NZ calculated by .
Step 4. SSA-FARY: Perform SSA-FARY on with the window size tuned to estimate the signal component that is most relevant for the respiratory motion.
Motion-Resolved Model-Based Reconstruction
The acquired k-space data is then sorted into 6 respiration and 20 cardiac bins using amplitude binning [36] based on the estimated respiratory signal and the recorded ECG signal. The MR physical parameter maps in Equation (1) for the selected motion states are estimated directly from k-space using a calibrationless model-based reconstruction [24, 27]. Here, to further exploit sparsity along the motion dimensions, the previous model-based reconstruction is extended to the motion-resolved case by formulating the estimation of unknowns from the selected motion states as a single regularized nonlinear inverse problem:
| (4) |
where F is a nonlinear operator [27] mapping all unknowns x to the sorted k-space data Y. TR, TC are the numbers of respiration and cardiac bins, respectively. x = (xm, xc)T where xm contains MR physical parameter maps in Equation (1), i.e., of all the selected motion states and xc represents coil sensitivity maps for the corresponding motion states. S is a convex set ensuring non-negativity of the relaxation rate . For the regularization R(·), we first adopt the joint ℓ1-Wavelet spatial constraints [24]. Second, we add the temporal total variation (TV) regularization to explore sparsity along the motion dimensions [37]. Furthermore, as a pure TV may favor straight lines if applied along the motion dimension only, we utilize a joint TV regularization along spatial and temporal dimensions to better preserve the spatio-temporal information. Thus, R(·) reads:
| (5) |
with the joint ℓ1-Wavelet spatial regularization and Dx, Dy, Dc and Dr the gradient operators along the x, y, cardiac and respiratory dimensions, respectively. λ1, λ2, λ3, λ4 and λ5 are the corresponding weighting parameters, balancing the effects of different regularization terms. α is a global regularization parameter on R(·). U(·) represents the Sobolev regularization term [38] on the coil sensitivity maps with β the regularization parameter. Similar to [24, 27], the above nonlinear inverse problem is solved by the iteratively regularized Gauss-Newton method (IRGNM) algorithm [39] where the nonlinear problem in Equation (4) is linearizedly solved in each Gauss-Newton step. To enable the use of multiple regularizations, the ADMM algorithm [40] was employed to solve the linearized subproblem. More details of the proposed IRGNM-ADMM algorithm can be found in Appendix I.
Methods
Data Acquisition
All MRI experiments were performed on a Magnetom Skyra 3T (Siemens Healthineers, Erlangen, Germany) with approval of the local ethics committee. Animal care and all experimental procedures were performed in strict accordance with the German and National Institutes of Health animal legislation guidelines and were approved by the local animal care and use committees. Validations were first performed on a commercial reference phantom (Diagnostic Sonar LTD, Scotland, UK) consisting of 6 compartments with defined T1 values surrounded by water. Phantom scans employed a 20-channel head/neck coil, while in vivo measurements used combined thorax and spine coils with 26 channels. In the phantom study, the delay time TD in the sequence was varied from 5 s to 1 s (with a step size of 1 s) to study T1 accuracy and precision when using the proposed T1 estimation procedure. An optimal value of TD was then chosen for subsequent in vivo studies. Informed written consent was obtained from all subjects prior to MRI. In vivo scans were performed during free-breathing using the free-running sequence. The ECG signals were recorded for later use but not for triggering. To assess repeatability of the proposed method, the sequence was repeated twice in the middle short-axis slice for each subject. Data from basal and apical slices were additionally acquired for a subset of subjects. After excluding measurements with non-reliable ECG signal, data sets from eleven subjects (seven female, four male, age 25 ± 4, range 21 – 37 years; heart rates 63 ± 9 bpm, range 50 – 77 bpm) were used in this work (including six subjects with basal and apical slices). For FLASH readout, spoiling of the residual transverse magnetization was achieved using random radiofrequency (RF) phases [41]. The other acquisition parameters were: field of view (FOV) = 256 × 256 mm2, slice thickness = 6 mm, matrix size = 256 × 256, TR/echo time (TE) = 3.27–3.30/1.98 ms, RF-pulse time-bandwidth product = 4.5, nominal flip angle = 6°, receiver bandwidth = 810 Hz/pixel and total acquisition time of 21 inversions, i.e., around 2 min with 915 radial spokes per inversion. A window size of 21 frames was chosen for the adapted SSA-FARY technique [28]. Further, one data set from a young landrace pig with infarcted myocardium (regions in the septum and anterior wall due to intermittent left anterior descending artery occlusion) was acquired on the mid-ventricular short-axis slice using the same free-running acquisition parameters described above.
For reference, gold standard T1 mapping was performed on the phantom using an IR spin-echo method [42] with 9 IR scans (TI = 30, 530, 1030, 1530, 2030, 2530, 3030, 3530, 4030 ms), TR/TE = 4050/12 ms, FOV = 192 × 192 mm2, slice thickness = 5 mm, matrix size = 192 × 192, and a total acquisition time of 2.4 h. For in vivo studies, a 5(3)3 MOLLI reference sequence with a hyperbolic tangent inversion pulse [43] provided by the vendor was applied for end-diastolic T1 mapping using a FOV of 360 × 306.6 mm2, in-plane resolution = 1.41 × 1.41 × 8 mm3, TR/TE = 2.7/1.12 ms, nominal flip angle = 35°, receiver bandwidth=1085 Hz/pixel and an acquisition period of 11 heart beats during a single breathhold. A correction factor was further applied to the final MOLLI T1 map to accommodate for the imperfect inversion [43].
Iterative Reconstruction
The motion-resolved model-based reconstruction algorithm was implemented using the nonlinear operator and optimization framework in C/CUDA in the Berkeley Advanced Reconstruction Toolbox (BART) [44]. To reduce computational demand, we selected three respiratory motion bins (out of 6) close to the end-respiratory state and all cardiac bins for the motion-resolved quantitative reconstruction. Similar to [24], we initialized the parameter maps with (1.0, 1.0, 1.5)T and all coil sensitivities with zeros in the IRGNM-ADMM algorithm. Moreover, as a high accuracy is usually not necessary during the first Gauss-Newton steps, we set the number of ADMM iteration steps to be Nn = min(100, 2Nn−1) at the n-th Gauss-Newton step with N0 = 10. This setting resulted in stable reconstructions for all cases tested.
Regularization parameters were tuned to balance the preservation of image details versus reduction of noise. The regularization parameters α and β were initialized with 1.0 and subsequently reduced by a factor of three in each Gauss-Newton step. A minimum value of α was used to control the noise of the estimated parameter maps even with a large number of Gauss-Newton steps, i.e., αn+1 = max(αmin, (1/3)n · α0). The optimal value αmin as well as the weighting parameters λs were chosen manually to optimize the signal-to-noise ratio (SNR) without compromising the quantitative accuracy or delineation of structural details. Particularly, αmin was tuned from 0.004 to 0.007 with the optimal value chosen by visual inspection. λ1 was set to be 0.2 and parameters (λ2, λ3, λ4, λ5)T in the weighted spatio-temporal TV regularization term in Equation (5) were set to be (0.4, 0.4, 1.0, 0.2)T. For comparison, the other types of regularization, such as the spatial-only (ℓ1-Wavelet) regularization (R(xm) = λ1∥Wxm∥1), temporal TV regularization (R(xm) = λ4∥Dcxm∥1 + λ5∥Drxm∥1) and the combination of the above two (R(xm) = λ1∥Wxm∥1 + λ4∥Dcxm∥1 + λ5∥Drxm∥1) were also implemented and first evaluated on a simulated dynamic phantom using the parallel imaging and compressed sensing (PICS) tool in BART, followed by the evaluation on the data of one subject with the proposed motion-resolved model-based reconstruction. More details regarding the simulated dynamic phantom can be found in Section III of the Supporting Information File.
With the above parameter settings, all image reconstruction was done offline. After gradient-delay correction [45] and channel compression to six principal components, the multi-coil radial data were gridded onto a Cartesian grid, where all successive iterations were then performed using FFT-based convolutions with the point-spread function [46]. To reduce memory demand during iterations, 15 spokes were binned into one k-space frame prior to model-based reconstruction, resulting in a nominal temporal resolution of around 49 ms. To allow for efficient reconstructions, implementations were optimized in BART (see Section IV of the Supporting Information File) so that all computations could run on a GPU (A100, NVIDIA, Santa Clara, CA) with a memory of 80 GB. It then took around 20 – 30 minutes to reconstruct one in vivo data set using the above reconstruction parameters.
T1 Analysis
All quantitative T1 results are reported as mean ± standard deviation (SD). For the in vivo studies, T1 maps from the end-diastolic and end-respiratory phase were selected for quantitative assessment of the proposed method. Regions-of-interest (ROIs) were carefully drawn into the myocardial segments model defined by the American Heart Association (AHA) [47] with 6 segments in the basal and middle slices and 4 segments in the apical slice using the arrayShow [48] tool in MATLAB (MathWorks, Natick, MA). The mean T1 values were calculated for each segment across all subjects and scans, and were visualized with bullseye plots. The repeatability error was calculated using , with T1diff(i) the T1 difference between two repeated measurements and ns the number of subjects. The precision of T1 estimation was computed using the coefficient of variation (CoV = SDROI / MeanROI × 100%). Further, Bland-Altman analyses were performed to compare ROI-based mean T1 values between different T1 mapping techniques. The two-tailed Student’s t-tests were utilized for comparison, and a p value < 0.05 was considered significant. In addition, to quantify the in-plane cardiac motion between end-diastolic and end-systolic phases, the relative difference of the left-ventricular area (AreaEnd-Diastolic − AreaEnd-Systolic / AreaEnd-Diastolic × 100%), similar to the left-ventricular ejection fraction (LVEF) index for the volume case, was calculated based on the mid-ventricular myocardial T1 maps. The blood–myocardium boundary was manually segmented using the aforementioned arrayShow tool.
Results
Phantom Validation
We first validated the proposed T1 correction procedure for phantom T1 mapping when using different delay times in the multi-shot acquisition in comparison to an IR spin-echo reference. Figure 2 presents the estimated T1 maps for acquisitions with delay times ranging from five seconds to one second (step size one second) when using the conventional Look-Locker formula and the proposed procedure. Prior to T1 correction, all the physical parameters were estimated by the single-slice model-based reconstruction [24] using the data from the second inversion, where the initial magnetization is affected by incomplete recovery. Both quantitative T1 maps and T1 values of a ROI in Figure 2 as well as the Bland-Altman plots in the Supporting Information Figure S1 (A) reveal that the conventional Look-Locker correction underestimates T1: the smaller the delay time, the higher the bias. On the other hand, the proposed procedure could achieve good T1 accuracy regardless of the delay time, but at the expense of increased noise (i.e., lower precision) for short delays and large T1 times. This is mainly due to the fact that there is less T1 information encoded in the data for shorter delays. In the extreme case where there is no delay, it is impossible to recover T1 (i.e., decouple T1 and from ) as no explicit T1 is encoded in the data. According to these results, a delay time of two or three seconds is a good compromise between short acquisition time and good T1 precision. We choose three seconds for the other acquisitions in this study.
Figure 2.
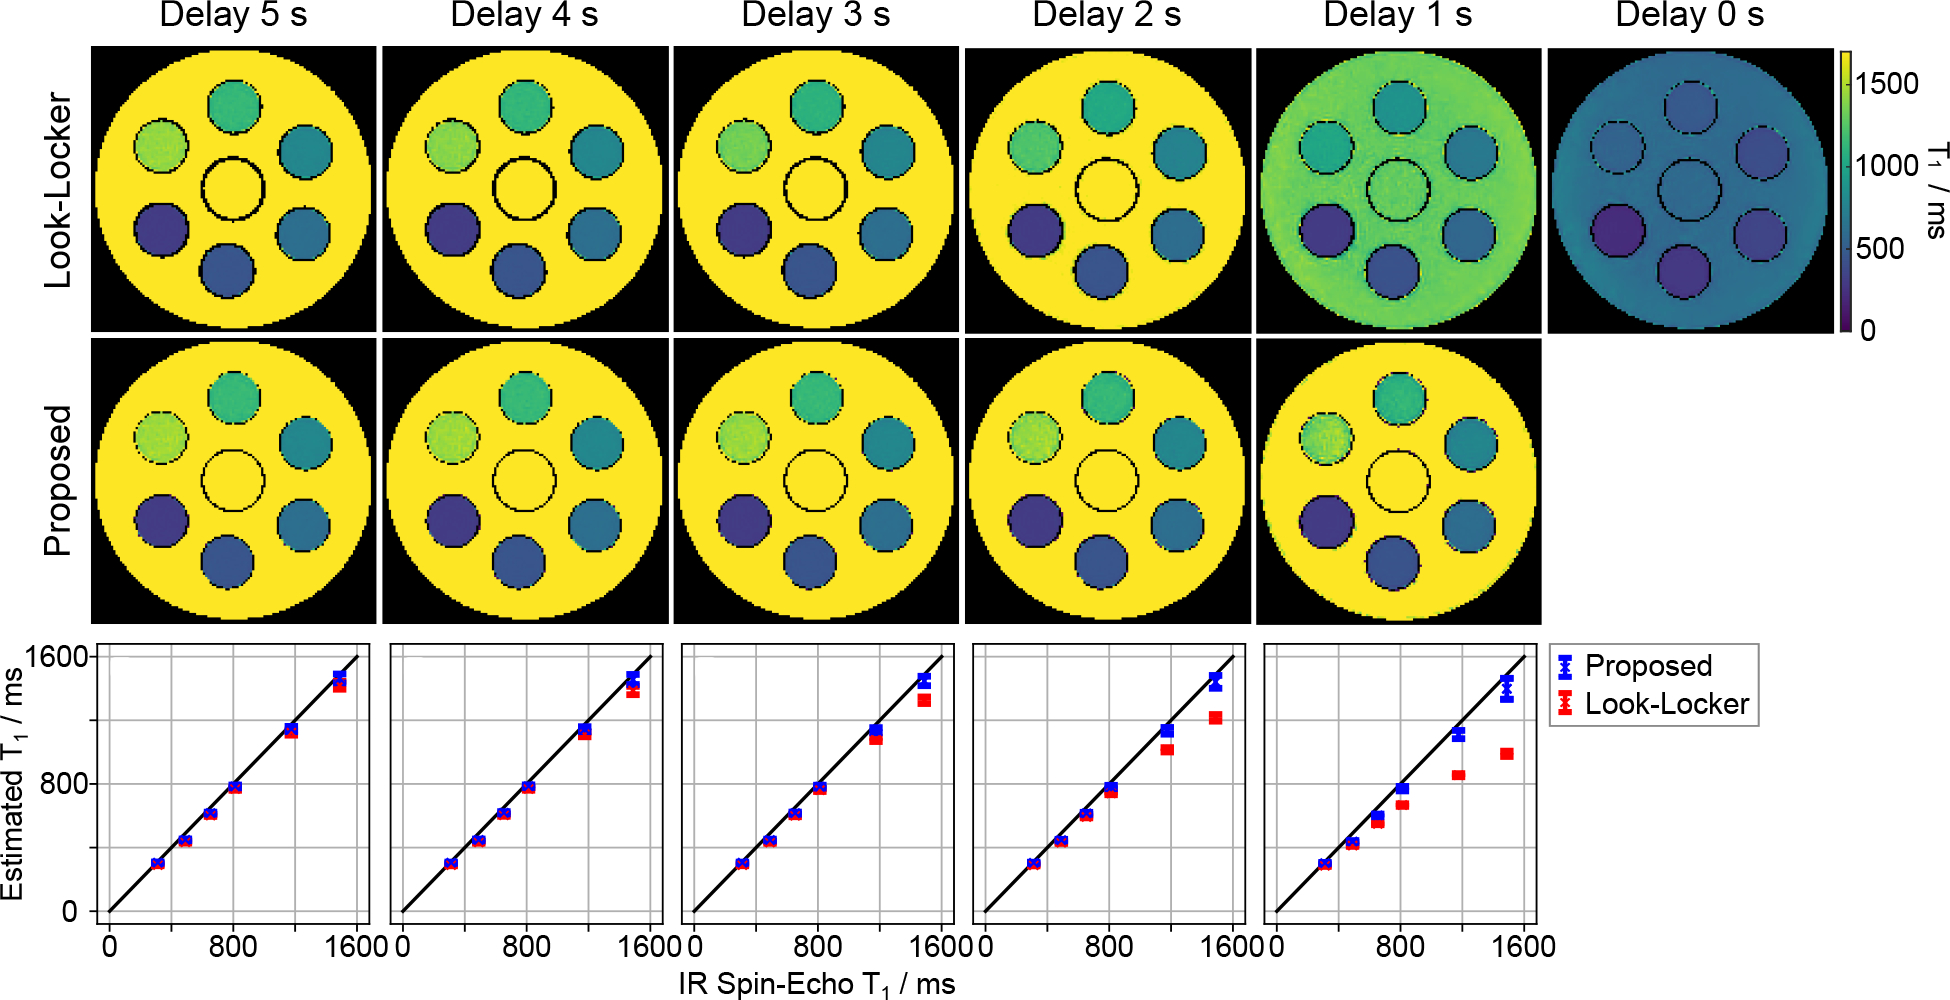
Quantitative phantom T1 maps with various delay times from 5 s to 1 s (step size 1 s) using (top) the conventional Look-Locker correction and (middle) the proposed formula. (Bottom) Quantitative T1 values (mean and standard deviation) within ROIs of the 6 phantom tubes in comparison to an IR spin-echo reference. The corresponding Bland-Altman plots are shown in the Supporting Information Figure S1 (A).
Subsequently, we evaluated the proposed motion-resolved model-based reconstruction on the same phantom using the multi-shot data with the delay time of three seconds. The data has been sorted into 6 respiratory and 20 cardiac motion states based on the motion signals estimated from one human subject (subject #3, scan #1). Figure 3 (top) shows the estimated phantom T1 maps (selected at the end-expiration and end-diastolic phase) with the spatial-only regularization using two different regularization parameters αmin = 0.005 and αmin = 0.02, and its combination with the spatio-temporal TV regularization with αmin = 0.005. Figure 3 (bottom) plots the corresponding quantitative T1 values of the ROI against the IR spin-echo reference. The Supporting Information Figure S1 (B) further presents the corresponding Bland-Altman plots. The above quantitative results show that all reconstructions could achieve good T1 accuracy. The increase of the regularization strength in the spatial-only regularization or the use of an additional spatio-temporal TV with the same regularization parameter is helpful for reducing noise (improving T1 precision) in the quantitative phantom T1 maps.
Figure 3.
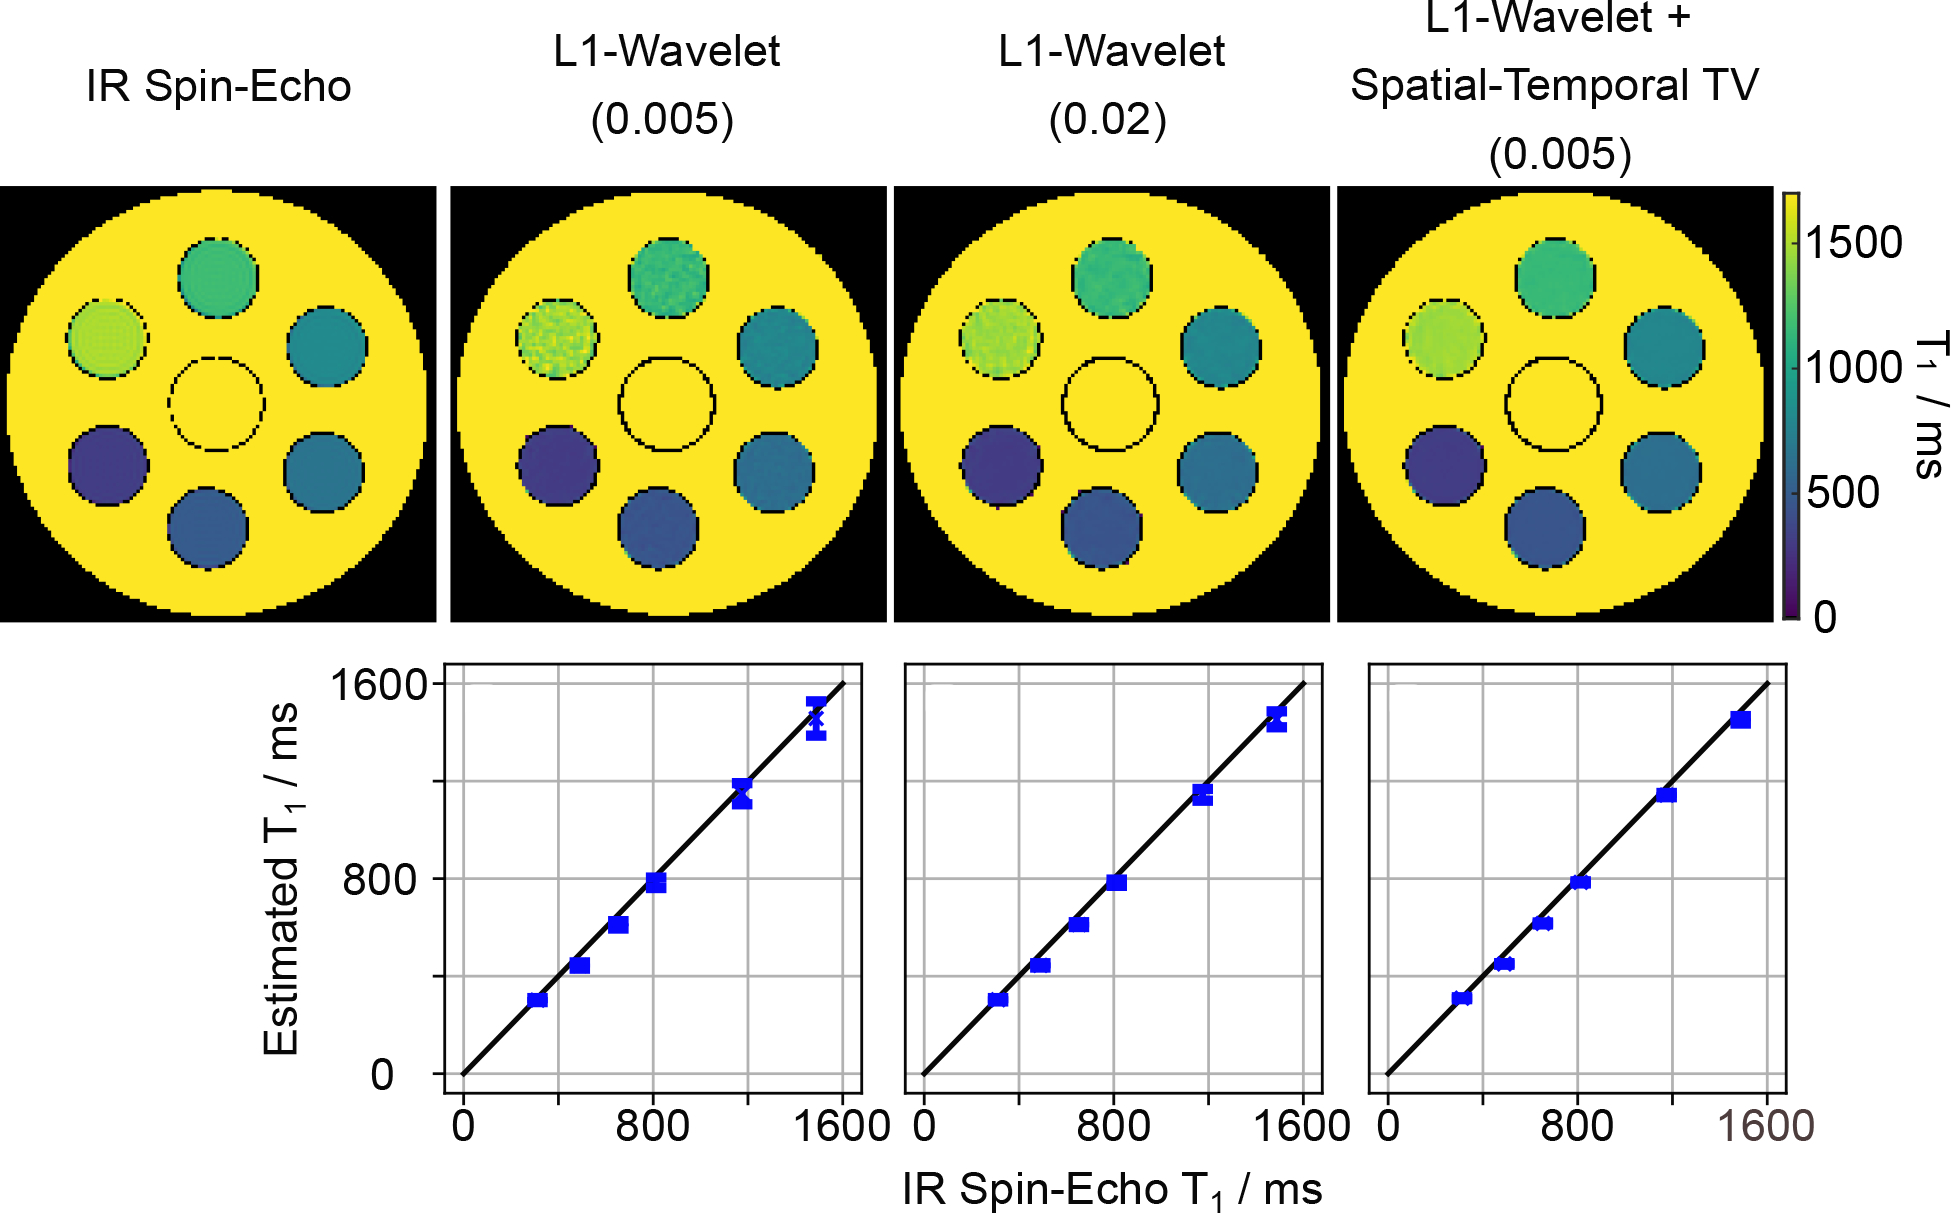
(Top) Phantom T1 maps reconstructed with different regularization using the motion-resolved model-based reconstruction in comparison to an IR spin-echo reference. (Bottom) Quantitative T1 values (mean and standard deviation) within ROIs of the 6 phantom tubes. The value in the bracket (top) indicates the regularization parameter αmin used for each reconstruction. The corresponding Bland-Altman plots are presented in the Supporting Information Figure S1 (B).
In Vivo Studies
Respiratory Motion Estimation
Figure 4 shows the DC component for one inversion recovery before and after data correction using the extended orthogonal projection with the order of harmonics NH set to five. Some coils exhibit strong oscillations. The oscillation period in the AC data is linked to the period of the projection angle used in the radial acquisition [28]. By removing this frequency and the higher-order harmonics, these oscillations can be largely eliminated. The filtered DC component is then used for self-gating.
Figure 4.
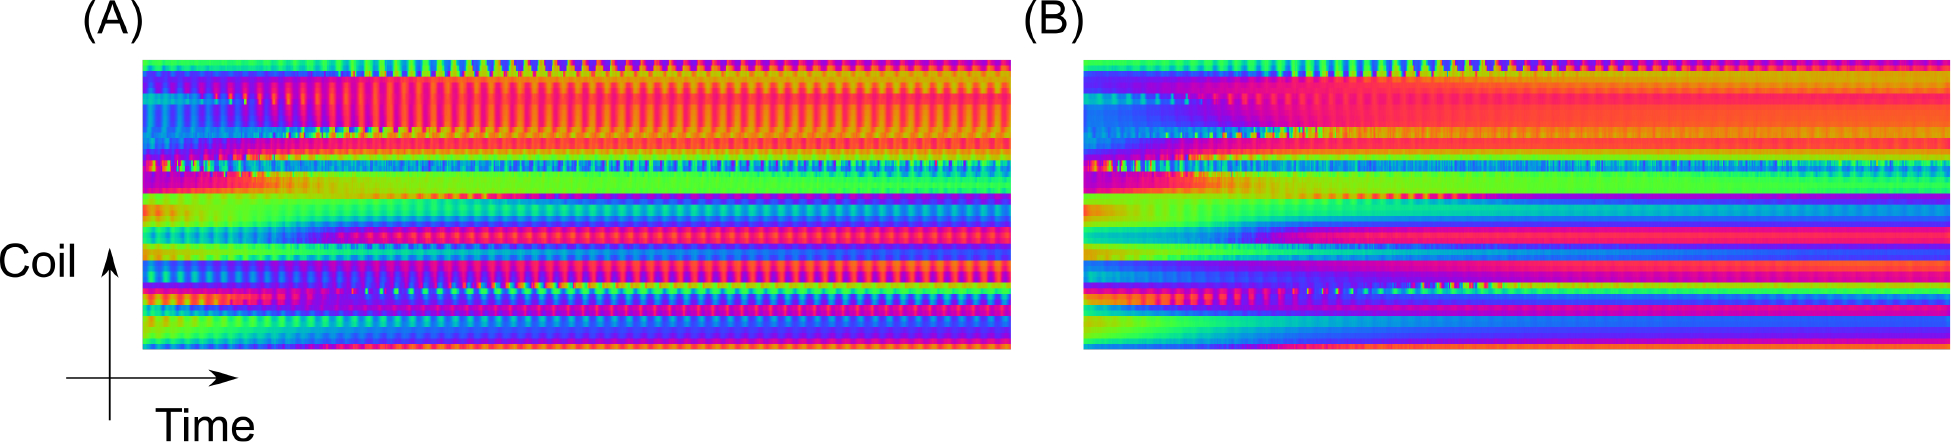
Snippet of the complex plot with color-coded phase of the DC samples used for auto-calibration before (A) and after (B) data correction with the extended orthogonal projection. Notably less disturbing oscillations are observed in B. The above snippet corresponds to one complete inversion recovery (3 s).
The background of Figure 5 (A) represents the temporal evolution of a line profile extracted from a real-time image reconstruction [46] of the free-running IR radial FLASH with 12 inversions. The line was placed in the vertical direction of the real-time image series where the diaphragmatic motion can be observed, as demonstrated by the white vertical line in Figure 5 (B). On top of the line profiles, the estimated respiratory signal and the signal provided by the respiratory belt are plotted. All motion signals have been scaled for better visual comparison. The estimated respiratory signal coincides well with the motion of the diaphragm in the real-time images. The adapted SSA-FARY technique could also provide reliable motion signal in the region where the respiratory belt failed to produce a signal (pointed out by a white arrow). Figure 4 (B) shows the corresponding steady-state images reconstructed with the non-uniform fast Fourier transform (nuFFT) after binning the data into 6 respiratory motion states using the estimated respiration signal. As indicated by the dashed lines, the different inspiration and expiration phases are well resolved. Figure 5 (C) and (D) show a similar comparison for the pig experiment where reliable respiratory signal can be obtained, suggesting robustness of the adapted SSA-FARY technique.
Figure 5.
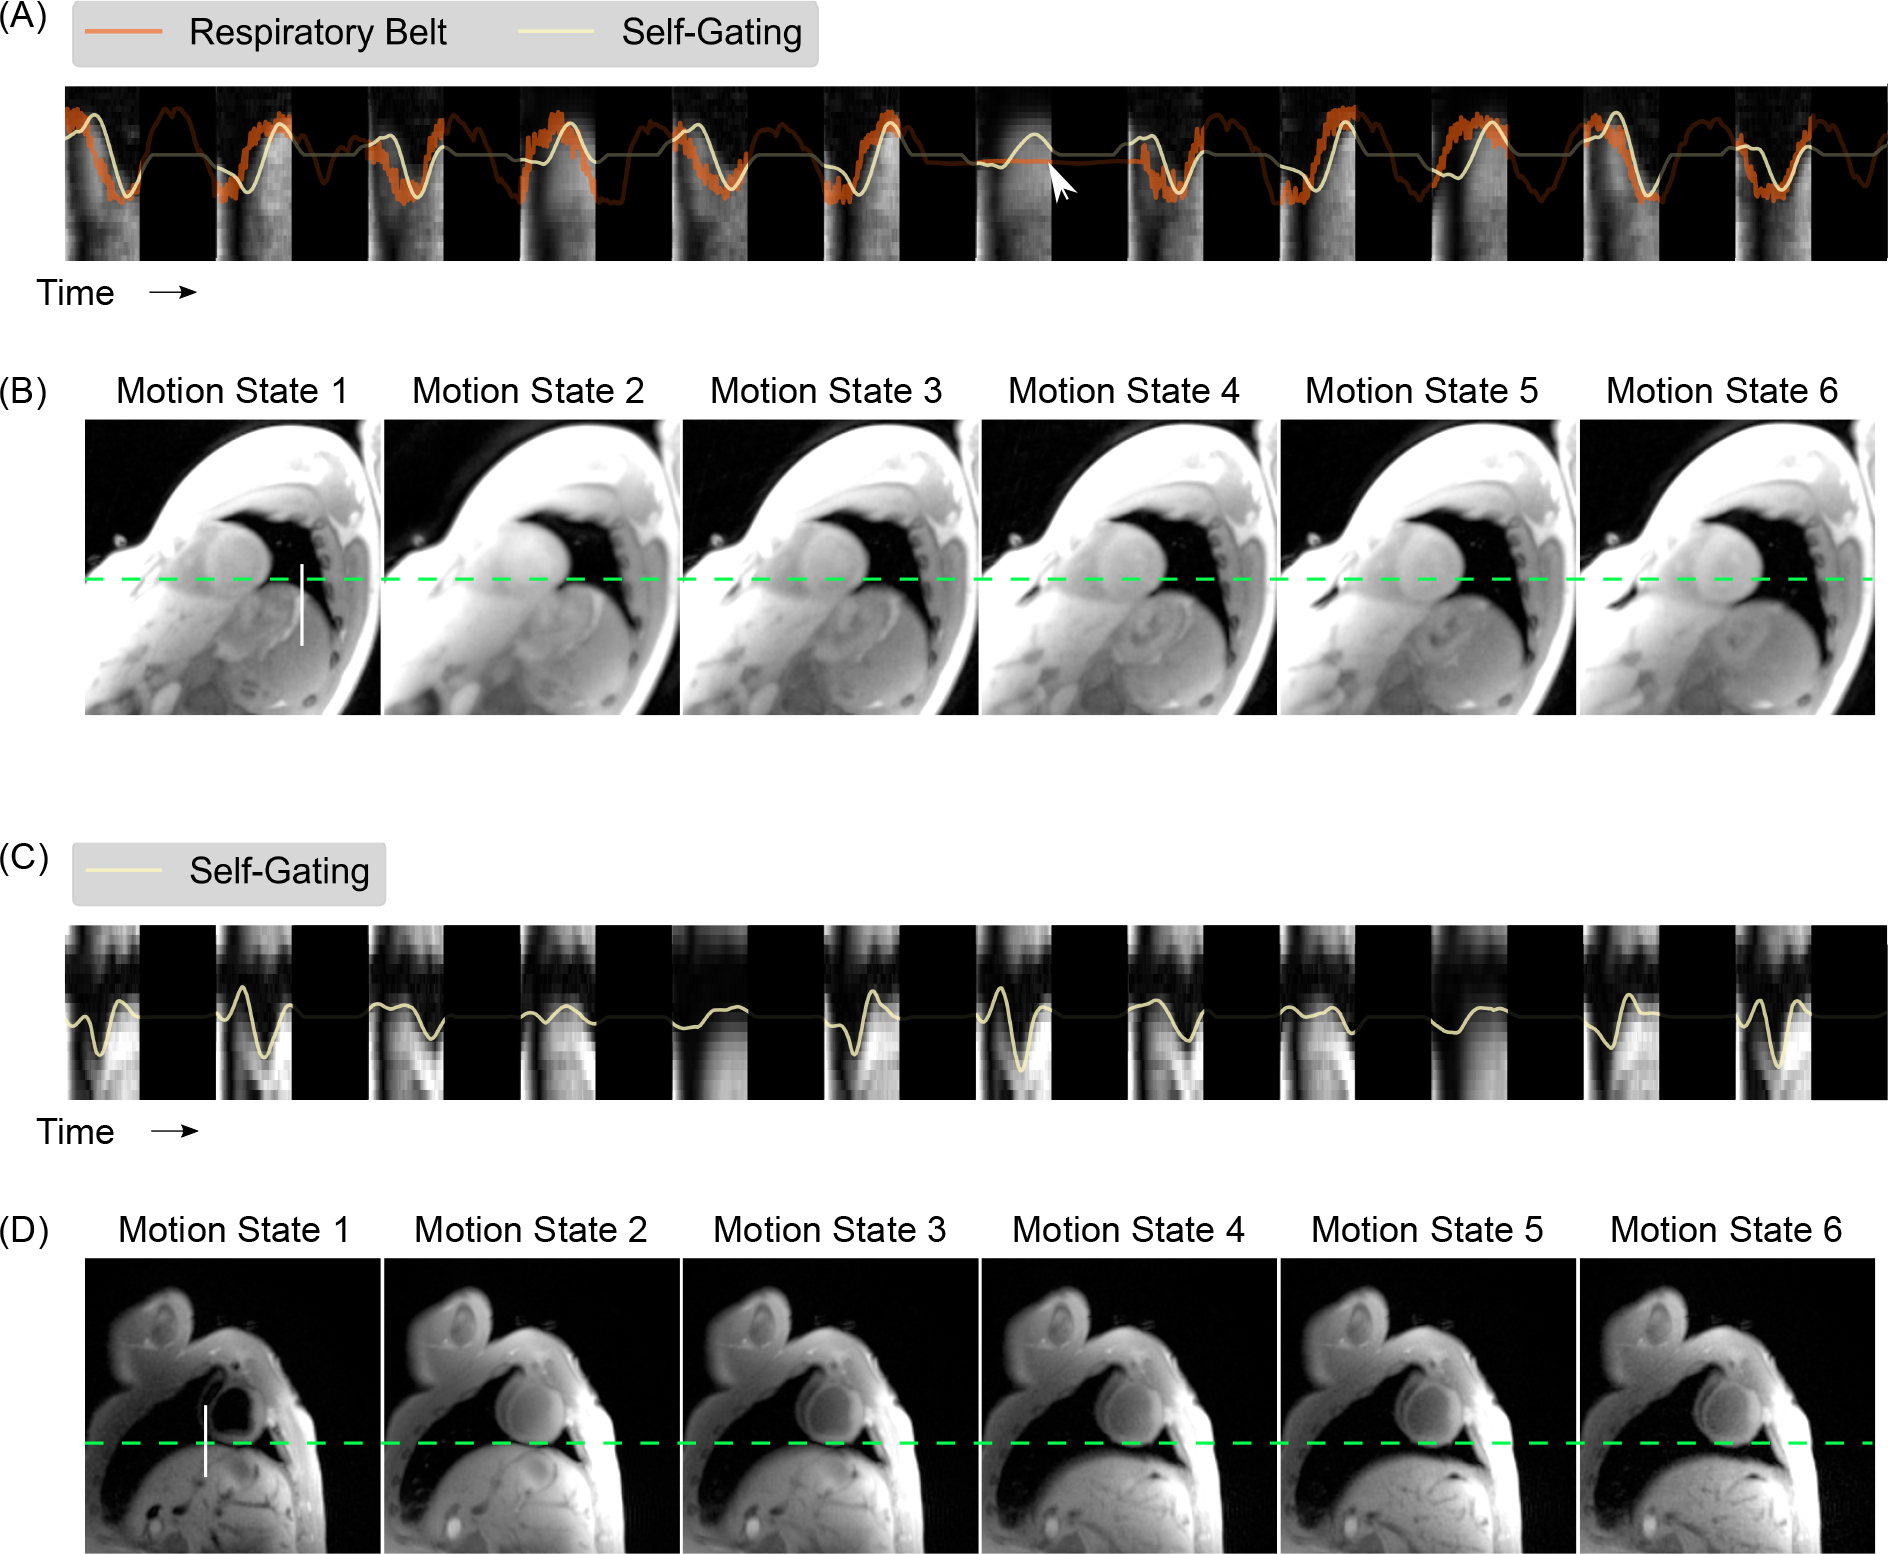
A. Comparison of the estimated respiratory signal with that obtained from the respiratory belt for 12 inversions for a healthy subject. The background image represents the temporal evolution of a vertical line profile (white line in B) extracted from a real-time image reconstruction [46] of the data acquired with free-running IR radial FLASH. The dark regions represent the time delay between inversions. The white arrow indicates a time point where the respiration belt failed to provide a signal. B. The corresponding steady-state images reconstructed by the non-uniform fast Fourier transform after binning the data (combing all cardiac phases) into 6 respiratory motion states. The dashed green line serves as a baseline for the end-respiration motion state. (C) and (D) show similar results for the pig experiment but with the respiratory belt signal absent.
Model-Based Myocardial T1 Mapping
We validated the effects of different regularization types used in the model-based reconstruction. Figure 6 shows myocardial T1 maps (at the selected end-expiration and end-diastolic phase) for one subject and the corresponding T1 line profiles (as indicated by the dashed black line) through all cardiac phases with various regularization types. The regularization parameter αmin has been optimized for each type of reconstruction individually. In particular, αmin was set to be 0.02, 0.02, 0.006 and 0.005 for spatial (ℓ1-Wavelet) only, temporal TV only, combined spatial (ℓ1-Wavelet) and temporal TV, and the proposed regularization that combines spatial (ℓ1-Wavelet) and a spatio-temporal TV, respectively. The spatial (ℓ1-Wavelet) only regularization creates noisy and degraded myocardial T1 maps. The temporal TV regularization could improve the image quality significantly by exploiting temporal sparsity. However, this kind of regularization also favors straight lines and thus creates “line”-like artifacts along the time/motion dimension (as seen the line profile images). The combination of spatial (ℓ1-Wavelet) and temporal TV regularization could reduce these “line”-like effects as a weaker temporal TV regularization is sufficient to achieve a similar denoising effect. Finally, the spatio-temporal TV regularization that combined both spatial and temporal information in a single multi-dimensional TV regularization, and its combination with the spatial (ℓ1-Wavelet) regularization, could achieve an even better compromise between denoising and the preservation of subtle motion in the line profiles (indicated by the black arrows) than the other types of regularization. Noteworthy, the myocardial T1 map from the spatial-only regularization is noisier than our previous single-shot results [27]. This is mainly due to the fact that there is much less data in one motion state in the motion-resolved reconstruction than the one in [27] which combines data from several diastolic phases (e.g., ~285 spokes vs ~800 spokes). The Supporting Information Figure S2 shows a similar comparison of the effects of various regularization types on a simulated dynamic phantom with three small tubes on the “myocardium”, mimicking certain “lesions”. Here, all reconstructions were done with the same regularization parameter. In line with the in vivo results presented here, the spatial regularization-only reconstruction results in blurred images with artifacts and signal inhomogeneities on the “myocardium” due to high undersampling. Temporal TV regularization is able to largely remove the above artifacts and improve image sharpness by exploiting the temporal sparsity but favors “line”-like artifacts along the motion dimension. On the contrary, the proposed spatio-temporal TV combined with the spatial (ℓ1-Wavelet) regularization has the best performance in denoising and preservation of both spatial and temporal structure details.
Figure 6.
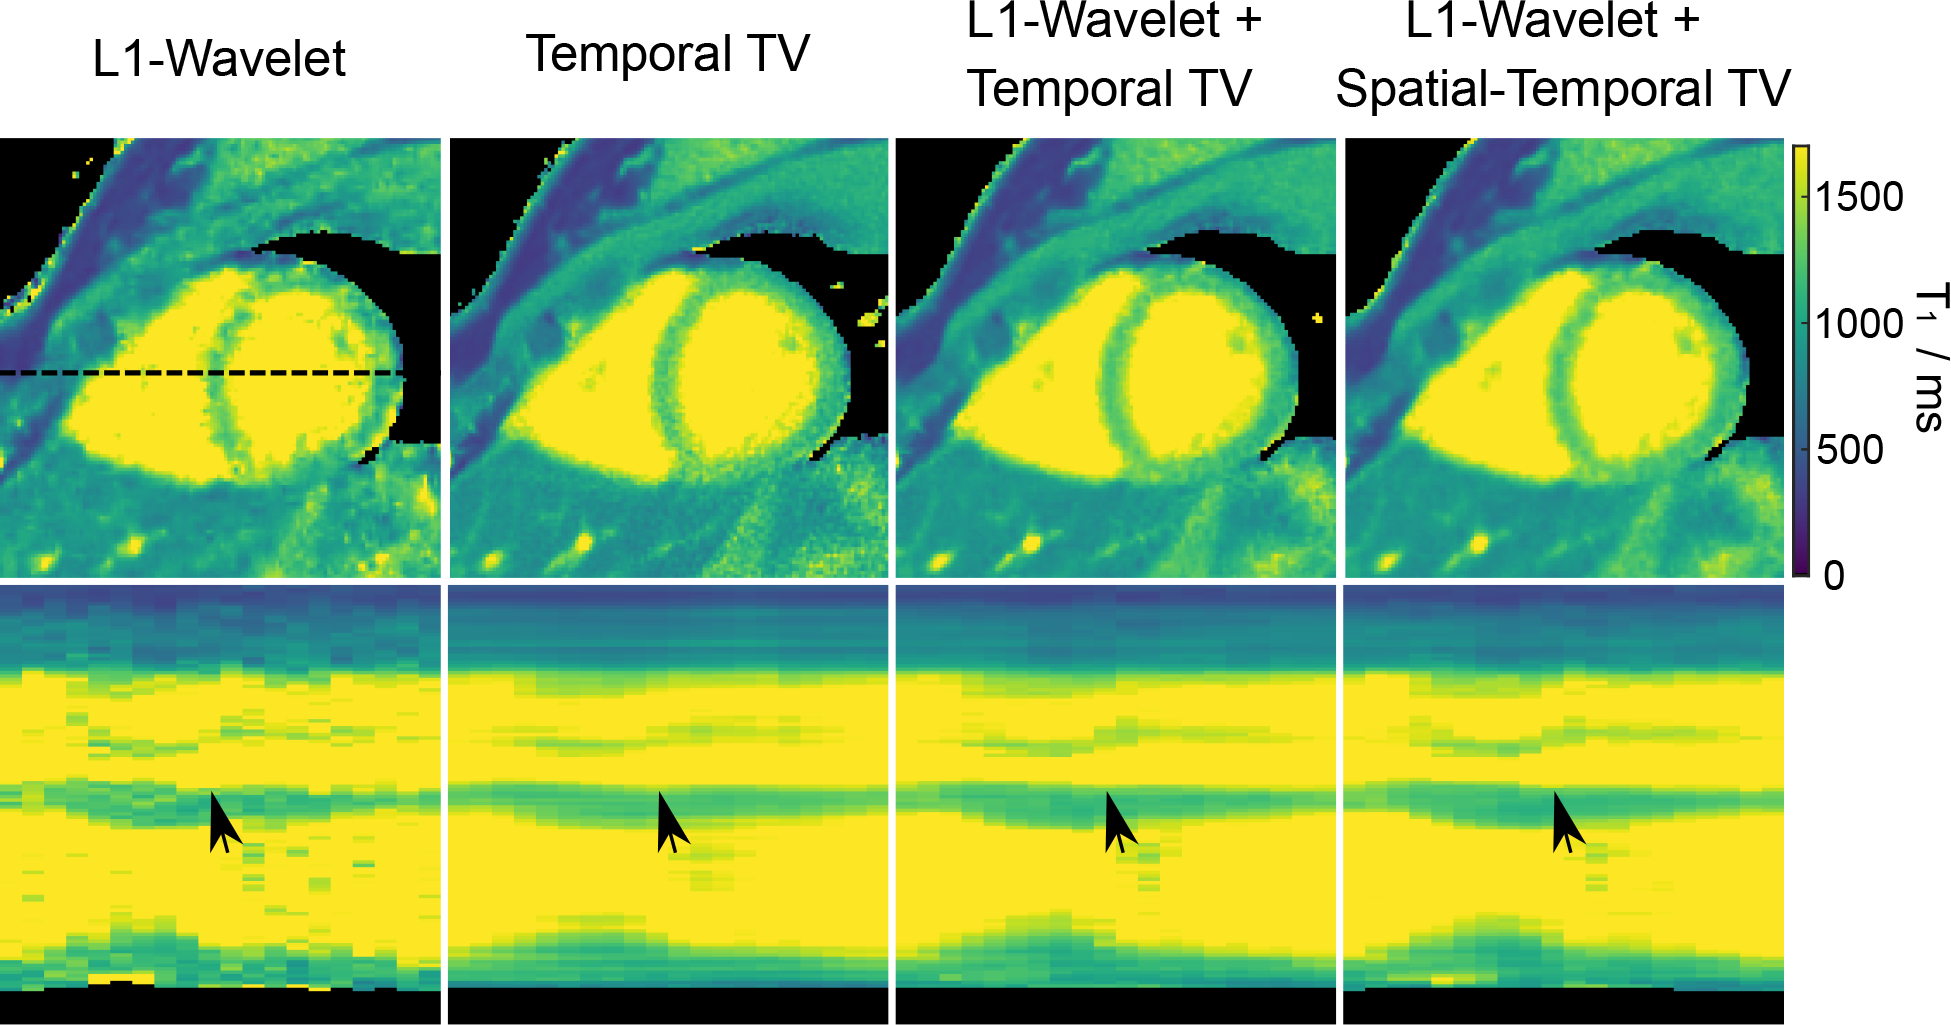
(Top) Myocardial T1 maps (end-expiration and end-diastolic) with different types of regularization using the proposed motion-resolved model-based reconstruction. (Bottom) Horizontal profiles (dashed black line in the top) through all cardiac phases. The black arrows indicate subtle wall motion that is preserved best with the spatio-temporal TV regularization. Note that the regularization parameter αmin for each regularization type was tuned individually to achieve a fair comparison.
Figure 7(A) shows the effects of the minimum regularization parameter αmin on myocardial T1 maps and the line profiles through the cardiac phases using the combination of the spatio-temporal TV and the spatial (ℓ1-Wavelet) regularization. Figure 7 (B) presents the corresponding quantitative myocardial septal T1 values for the ROI. As expected, both qualitative and quantitative results reveal that low values of αmin result in noisy maps (higher standard deviation) while high values may introduce blurring in the images. αmin = 0.005 was then chosen to balance noise reduction and preservation of anatomical details.
Figure 7.
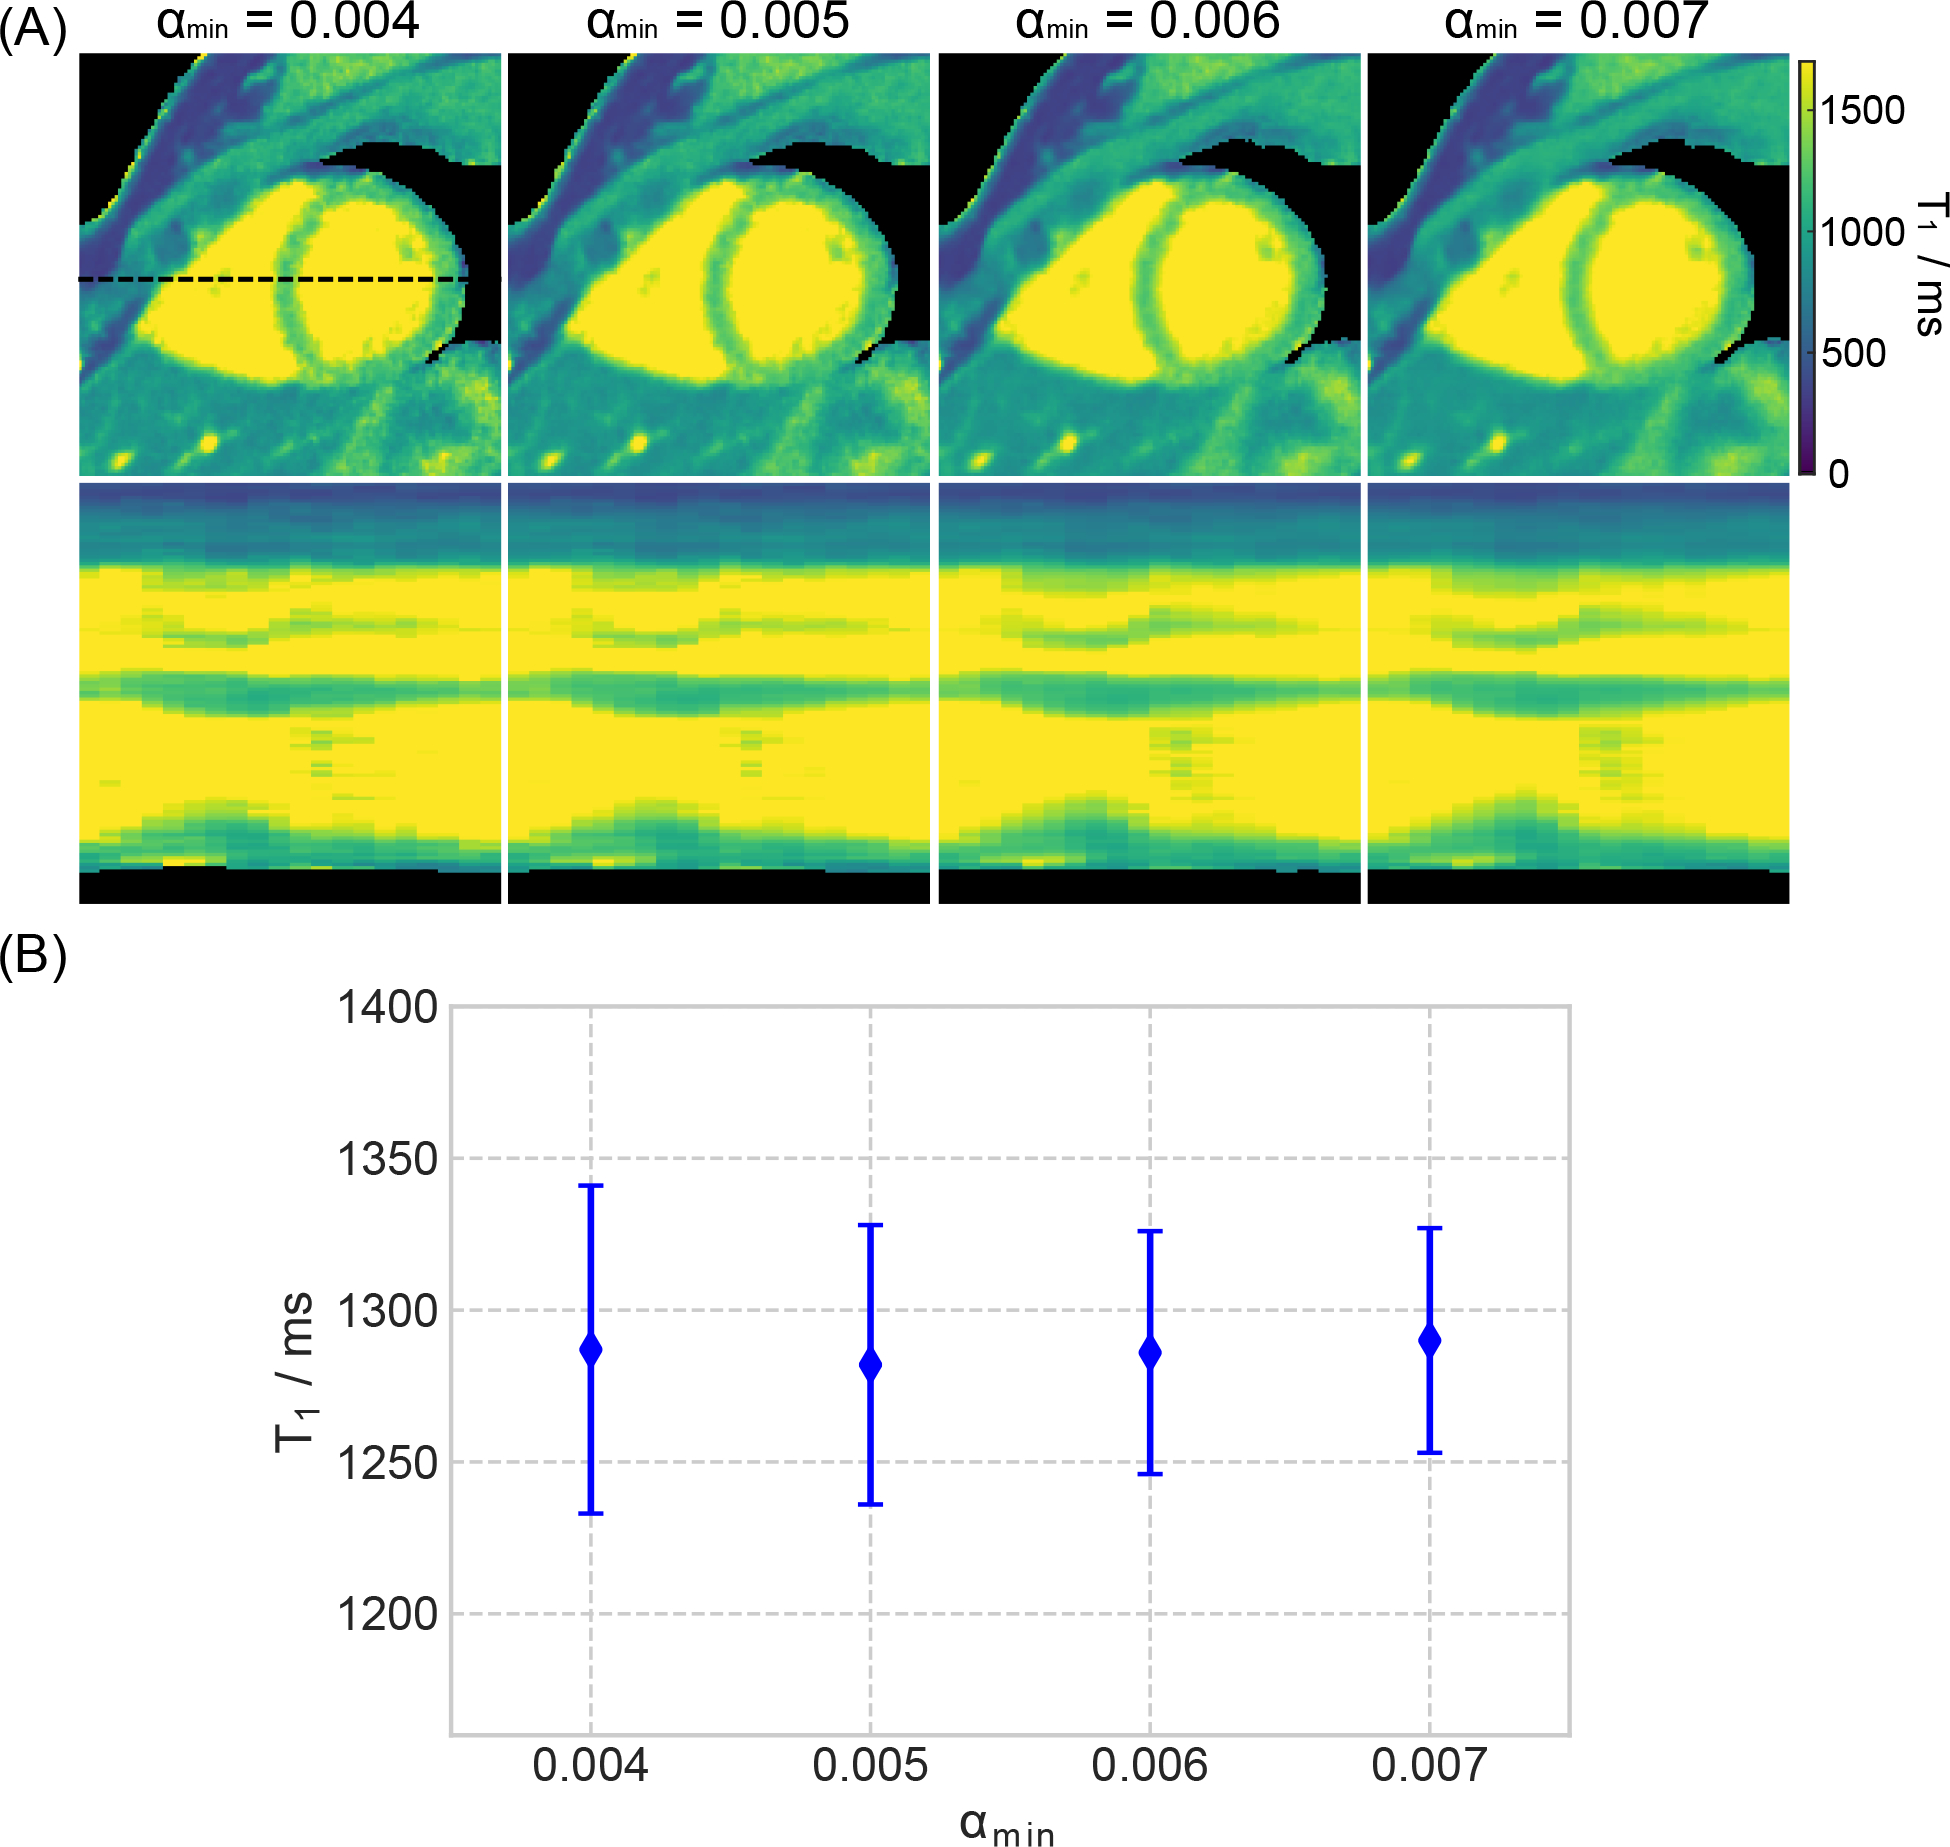
A. (Top) Myocardial T1 maps (end-expiration and end-diastolic) estimated with motion-resolved model-based reconstruction with different choices of the minimum regularization parameter αmin. (Bottom) Horizontal profiles (dashed black line in the top) through all cardiac phases. B. Quantitative T1 values (mean and standard deviation) within a ROI in the septal region.
With the above settings, Figure 8 shows a MOLLI T1 map and two mid-ventricular myocardial T1 maps at the end-diastolic and end-systolic phases (the same respiratory motion state) as well as the T1 line profile through the cardiac phase using the proposed method for two representative subjects. Although the breathing conditions are different, diastolic myocardial T1 maps are visually comparable between MOLLI and the free-breathing technique. Besides the diastolic T1 map, the proposed method could also provide myocardial T1 maps at other cardiac phases.
Figure 8.
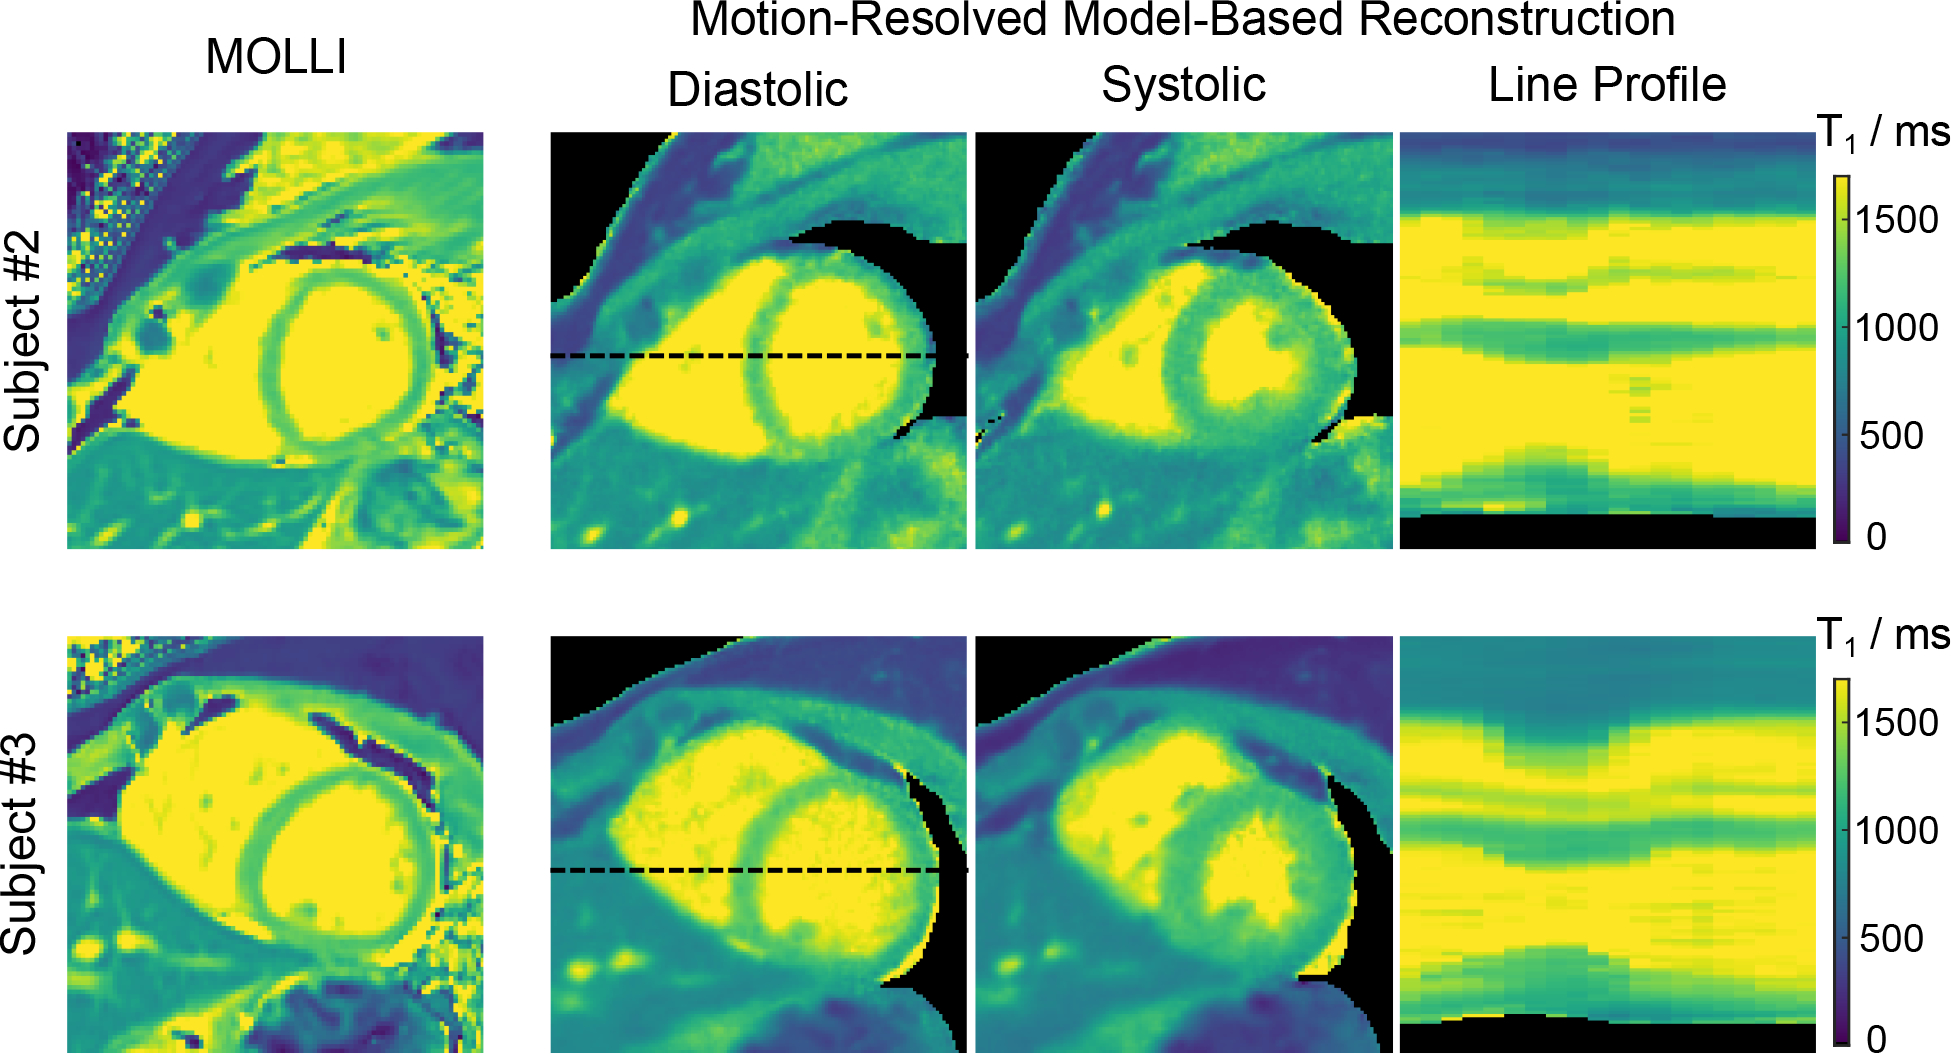
Diastolic and systolic myocardial T1 maps (end-expiration) and line profiles through the cardiac phase of the motion-resolved model-based reconstruction acquired during free breathing in comparison to MOLLI acquired in a breathhold for two representative subjects.
The Supporting Information Figure S3 then presents two repetitive mid-ventricular myocardial T1 maps (end-expiration and end-diastolic) of the proposed method and a MOLLI T1 map for all subjects. Despite differences in breathing conditions between scans, the free-breathing T1 maps are visually comparable between the two repetitive scans for all subjects. Figure 9 (A) shows the Bullseye plots of quantitative T1 values and measurement repeatability errors for the six mid-ventricular segments of all subjects and scans for both the proposed motion-resolved model-based reconstruction and MOLLI techniques. Figure 9 (B) compares diastolic T1 values for all mid-ventricular segments and septal segments (segments 8 and 9 according to AHA) for both methods. The paired t-test comparisons for each segment are summarized in the Supporting Information Table S3. The above quantitative comparison demonstrates that the proposed technique has slightly shorter mean T1 values for all segments (1218 ± 56 ms vs 1231 ± 40 ms) but longer T1 values for the septum segments (1262 ± 38 ms vs 1250 ± 28 ms) than MOLLI. However, no significant differences were found in most of the AHA segments, except for the lateral segments where MOLLI has longer T1 values. Noteworthy, all the above T1 values are within the published normal range at 3T [49]. Moreover, the proposed method has a slightly lower T1 precision (higher CoV values) than MOLLI (CoV: 4.5% ± 1.4% vs 2.8% ± 1.1%, p < 0.01) but are comparable to MOLLI in the repeatability errors (34 ± 12 ms vs 31 ± 13 ms, p = 0.73) for all mid-ventricular segments. The Bland-Altman plot in the Supporting Information Figure S4 further reveal that the proposed T1 correction formula generates longer T1 values than the conventional Look-Locker correction technique (1262 ± 38 ms vs 1238 ± 35 ms, p < 0.01).
Figure 9.
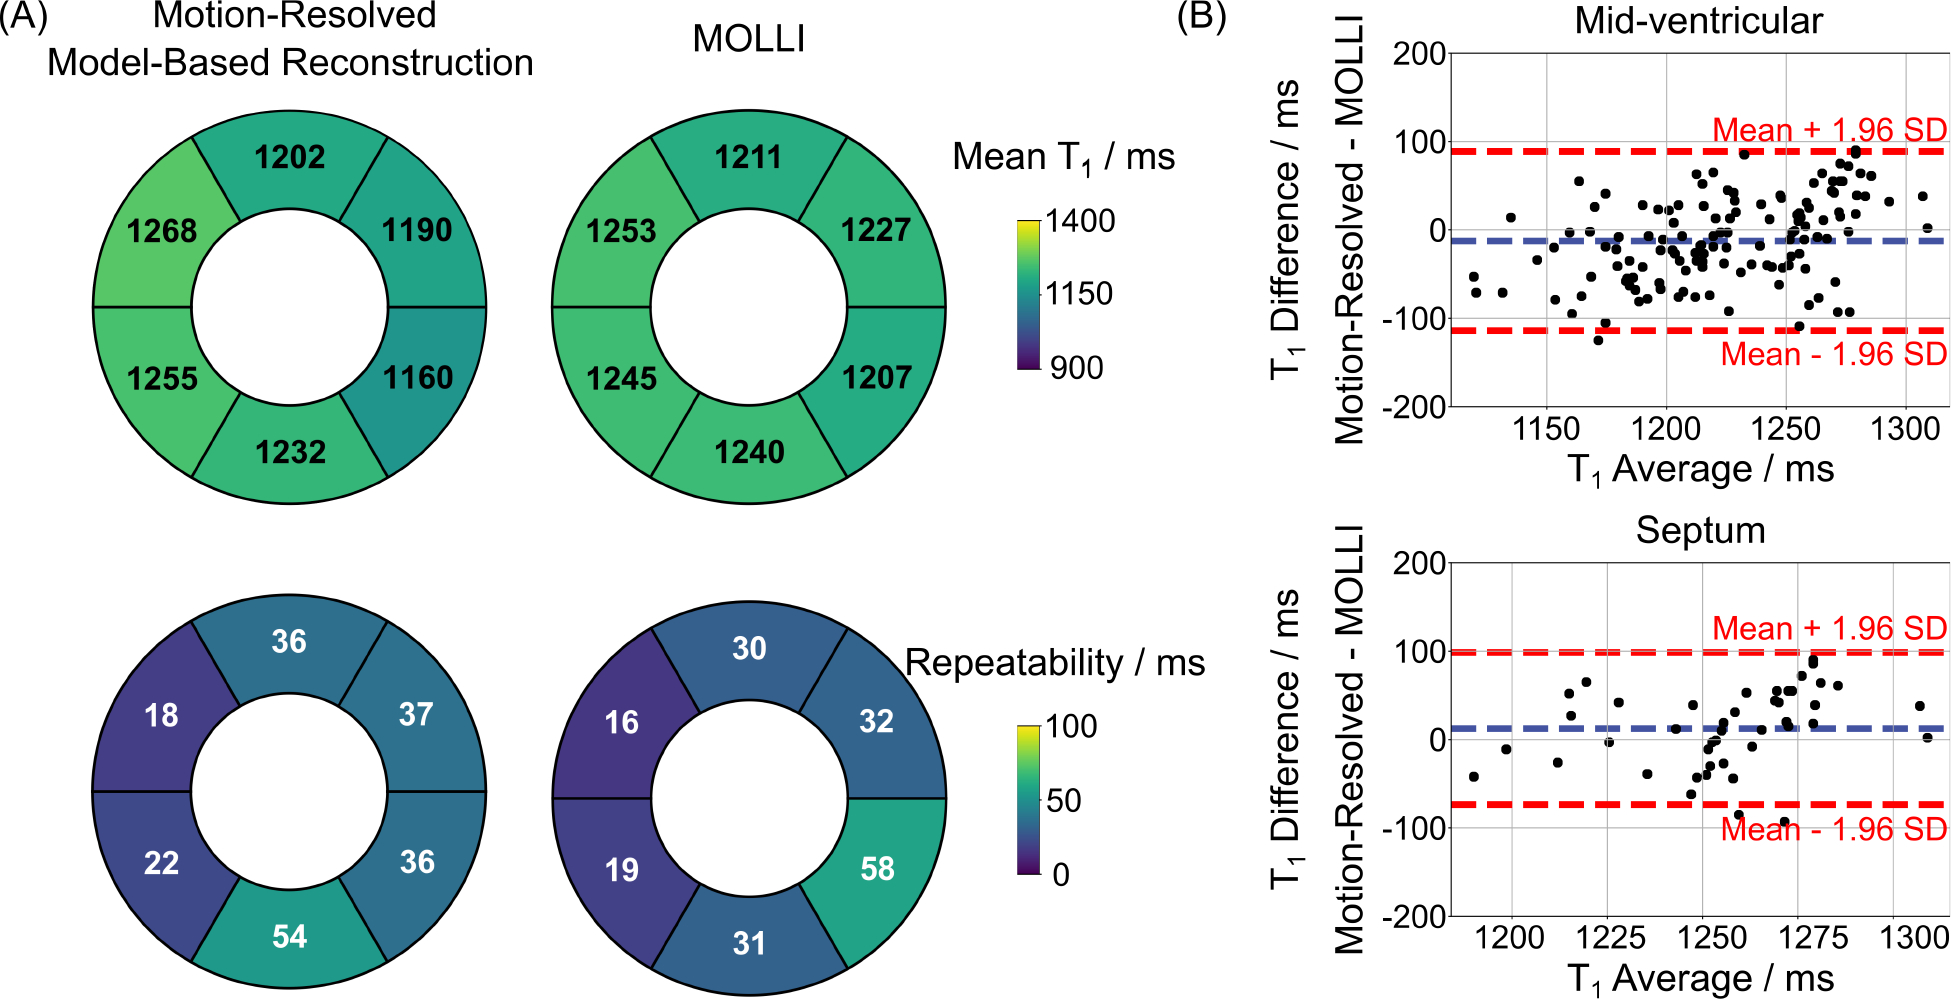
A. Bullseye plots of six mid-ventricular myocardial segments, showing (top) the mean diastolic T1 values and (bottom) the measurement repeatability errors for all eleven subjects and all scans for (left) the motion-resolved model-based reconstruction (free-breathing) and (right) the MOLLI method (breathhold), respectively. B. Bland–Altman plots comparing the mean diastolic T1 values of (top) all the six mid-ventricular segments (mean difference: −12 ms, SD: 52 ms) and (bottom) the septal segments (segments 8 and 9 according to AHA, mean difference: 12 ms, SD: 44 ms) for the proposed method and MOLLI for all subjects and scans.
Representative basal and apical diastolic myocardial T1 maps, in addition to the mid-slice T1 map, from two subjects, are shown in the Supporting Information Figure S5 (A). Quantitative results from both basal and apical slices and their comparison to MOLLI are presented in the Supporting Information Figure S5 (B) and (C). Again, although slight mean T1 difference is observed between the motion-resolved model-based reconstruction and MOLLI techniques, no significant differences were found in all basal and apical AHA segments as shown in the Supporting Information Table S3. The Supporting Information Table S4 further shows the relative difference of the left-ventricular area calculated from the myocardial T1 maps. We observe good repeatability (repeatability error: 3%) between scans. Although the results are obtained from a single slice, they are generally in the expected range for LVEF values. In addition, the quantitative T1 maps and ROI-analyzed T1 values in the Supporting Information Figure S6 demonstrate good agreement between the proposed approach and MOLLI for the pig experiment, i.e., both methods show higher and similar myocardial T1 values in the infarcted septal and anterior wall regions, suggesting robustness of the proposed approach.
Aside from quantitative myocardial T1 maps, Figure 10 presents synthesized T1-weighted cardiac images (bright blood and dark blood) at the two cardiac phases for the same subjects shown in Figure 8. Both the bright-blood and dark-blood-weighted images clearly resolve the contrast between myocardium and blood pool. The synthetic images and myocardial T1 maps at all cardiac phases were then converted into movies which are available as Supporting Information Videos S1 and S2. Similarly, a synthetic image series for all inversion times and all cardiac phases of one subject can be found in the Supporting Information Video S3.
Figure 10.
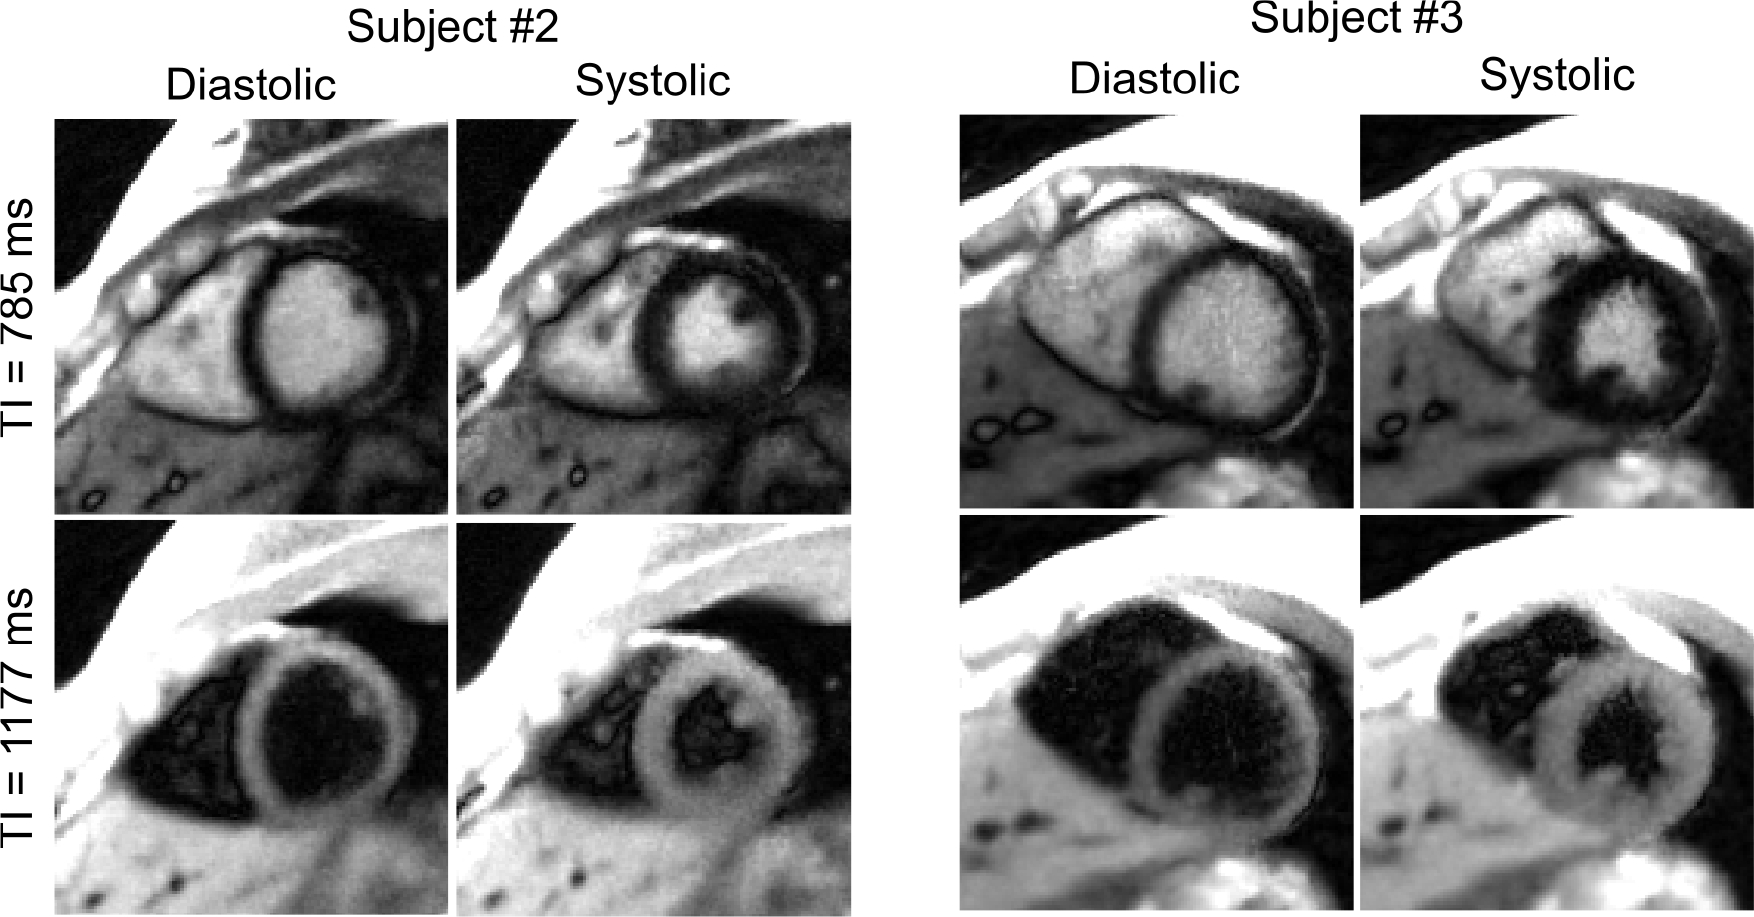
Synthesized T1-weighted images at two representative inversion times (bright blood and dark blood) for the end-diastolic and end-systolic cardiac phases for the same subjects shown in Figure 8.
Discussion
In this work, we have developed a free-breathing high-resolution myocardial T1 mapping technique using a free-running inversion-recovery radial FLASH sequence and a calibrationless motion-resolved model-based reconstruction. Instead of continuous acquisitions, we adopt a delay time between inversions to encode T1 information and have derived a correction procedure for accurate T1 estimation without needing full T1 recovery or additional mapping. We further adapted the SSA-FARY strategy for robust respiratory motion signal estimation from the zero-padded AC region where the trajectory-dependent oscillations and contrast changing signal (due to inversion) have been eliminated in preprocessing. Following self-gating and data sorting, we propose to estimate both parameter maps and coil sensitivity maps of the desired motion states directly from k-space using an extended motion-resolved model-based reconstruction. The latter avoids any coil calibration and can employ high-dimensional spatio-temporal TV regularization, in addition to the spatial regularization, to improve precision in T1 while preserving the spatio-temporal information. Studies have been performed on an experimental phantom, eleven healthy subjects and one young landrace pig with infarcted myocardium.
The phantom results demonstrate good T1 accuracy of the proposed approach over a wide range of T1 times. In vivo studies have shown similar diastolic myocardial T1 values between the proposed approach and MOLLI for all segments, except for the lateral segments. The T1 difference in the lateral regions between the two approaches and the difference between lateral and septal T1 values can also be seen in other T1 mapping techniques using continuous acquisitions, such as MR multitasking [15] and ref.[26]. The origin of these differences might be through-plane myocardial motion, which makes the lateral segments violate the assumed signal model. If new spins that experienced T1 instead of relaxation move into the imaging plane due to the through-plane motion, the total signal intensity will increase, resulting in a faster signal recovery, i.e., a shorter apparent T1 time. This is similar to the in-flow effects in blood T1 estimation, as analyzed by Hermann et al. [50]. Although T1 values in this work correspond well with MOLLI, the proposed approach may still underestimate T1 when compared to the saturation recovery-based approaches such as SASHA and SAPPHIRE. With a low flip-angle FLASH readout, the proposed sequence should be robust to B1 and slice profile effects [51]. The main contributing factor for the underestimation could be imperfect inversion caused by the non-selective hyperbolic secant pulse we used. The lateral regions are additionally affected by through-plane motion as explained above. The precision of the proposed method (CoV: 4.5% ± 1.4%) is lower than that of MOLLI (CoV: 2.8% ± 1.1%). Such a difference could be explained by the differences in the nominal spatial resolution (MOLLI: 1.4 × 1.4 × 8 mm3, the proposed: 1.0 × 1.0 × 6.0 mm3) and the readouts (MOLLI: Cartesian balanced SSFP, the proposed: radial FLASH). Nevertheless, the proposed approach shows comparable (CoV: 4.9% with 1.3 × 1.3 × 8 mm3 in ref. [26], CoV: 4.8% with 1.7 × 1.7 × 8 mm3 in MR multitasking [15]) or even slightly better (CoV: 5.7% with 1.6 × 1.6 × 8 mm3 in MRF [11]) T1 precision when comparing to other well-known techniques.
Continuous acquisitions with constant flip angles [16, 17] have been used in several inversion-prepared free-running T1 mapping techniques attributed to the scan efficiency. I.e., there is no waiting time between inversions. However, as pointed out by [19], continuous acquisition with the same flip angle only encodes information in the data [32]. Since is a function of flip angle and T1, additional information about is therefore necessary for accurate T1 estimation. However, the additional estimation of at the same motion state might be di cult to achieve in free-breathing, self-gated acquisitions. In [19], Zhou et al. propose to solve this issue by introducing a dual flip-angle strategy which acquires data continuously with two flip angles consecutively applied. Following self-gated data sorting, image reconstruction and dictionary matching, two different maps from the same motion state can be extracted and subsequently be used to calculate both T1 and maps in an iterative manner. Most recently, a similar idea has been proposed in the MR multitasking technique for more accurate T1 mapping [52]. Alternatively, in this work, we propose to resolve this problem by adopting a delay time between inversions, using this period for encoding T1 information in the data. Different from studies which set the delay time long enough to ensure a full recovery of longitudinal magnetization, we are capable of estimating accurate T1 even with incomplete T1 recovery, shortening the acquisition time. Moreover, the proposed approach requires neither additional mapping nor the explicit calculation of from the data.
Self-gating constitutes another key component for free-breathing imaging. Although a few self-gating techniques have been successfully developed for steady-state imaging, estimation of reliable motion signals from the contrast-modulated k-space is challenging. In this work, following removal of signal oscillations in the k-space center signal, we model the additive and multiplicative effects caused by inversion in the data following [35] and propose to reduce such effects prior to the application of the SSA-FARY-based self-gating techniques. From our experience, the above step is crucial for reliable motion estimation using SSA-FARY. Although the proposed method could achieve robust respiration signal estimation, determination of reliable cardiac signals from the filtered k-space remained challenging and retrospective ECG gating was used for binning. Resolving the latter issue in future work would be valuable as the ECG signal is not always reliable [34], which we also observed for several data sets acquired for this study.
Inspired by the high-dimensional imaging techniques [15, 37, 53–55], we have sorted the data into multiple cardiac and respiratory motion states, and applied high-dimensional regularization along these motion dimensions to improve T1 accuracy and precision. In contrast, several other studies [17, 19] combined data from multiple respiratory motion states into one using rigid image registration, following respiratory motion field being estimated from low-resolution images. The latter strategy has the advantage that more data is available for each cardiac phase than the one that sorts the data into multiple respiratory and cardiac motion states within the same amount of time. However, as motion between respiratory states is usually considered to be nonlinear [56] for cardiac imaging, a linear model may cause data mismatch in the cost function, resulting in reconstruction errors. Most recently, advanced nonlinear motion estimation methods have been developed for whole-heart coronary MR imaging [57]. Integration of such a nonlinear motion model into the model-based reconstruction framework would also be of great interest as it has the potential to shorten the total acquisition time of the proposed method while preserving good T1 accuracy and precision.
Spatio-Temporal regularization has been shown to be more effective in exploiting sparsity in compressed-sensing reconstructions for dynamic/high-dimensional imaging, resulting in higher accelerator factors than spatial regularization-only reconstruction [15, 37, 53]. This work confirms the above findings in the regularized nonlinear model-based reconstruction for dynamic myocardial T1 mapping. Moreover, our results demonstrate that the spatio-temporal TV regularization has a slightly better performance in both image denoising and preservation of structure details than the temporal TV regularization. On the other hand, although the regularization used in this study is effective in reducing noise/improving quantitative precision, it may also cause a certain degree of image blurring (lower effective spatial resolution) similar to other regularization techniques used in compressed sensing. More advanced regularization, such as neural network-enhanced regularizers [58] could be employed in future studies to solve this issue.
The proposed method takes around two minutes for reliable T1 estimation, which compares well to alternative techniques when considering the relatively high nominal resolution of the T1 maps (1.0 × 1.0 × 6 mm3). The acquisition time could be shorted by further reducing the delay time. Here, we adopted the three-second delay to achieve a good compromise of T1 accuracy and precision. However, in principle, a delay time of one second could be used (at a cost of lower precision), resulting in acquisition times of around 80 s.
There are also other limitations of the present work that need to be mentioned. First, the blood T1 estimated by methods using continuous acquisition may not be reliable as the in-flow effects make the blood violate the assumed signal model, a problem which also affects other methods based on continuous acquisition [17, 19, 50]. Thus, the proposed method is not ideal for estimating the extracellular volume (ECV). A thorough investigation of how blood T1 is affected by the proposed sequence using simulations and a flow phantom, similar to the work in [50], would be an interesting next step. Second, evaluation of the proposed method has so far only been done in healthy volunteers. Validation of the proposed free-breathing method in patient studies with both native and post-contrast T1 mapping is now warranted and will be the subject of future work. Another limitation of the proposed method is the long computation time. Although substantial efforts have been made in the implementation part to enable model-based reconstruction to run on GPUs, which already reduced reconstruction time from several hours to 25 minutes, further efforts are still needed.
Conclusion
The proposed free-breathing method enables high-resolution T1 mapping with good T1 accuracy, precision and repeatability by combing inversion-recovery radial FLASH, self-gating and a calibrationless motion-resolved model-based reconstruction.
Supplementary Material
Supporting Information Video S1. Synthesized T1-weighted image series (bright blood and dark blood) and the corresponding myocardial T1 maps through the cardiac phase dimension for subject #2.
Supporting Information Figure S1. A. Bland-Altman plots comparing ROI-analyzed phantom T1 values (top) between the original Look-Locker correction and the IR spin-echo reference (from left to right, mean difference: −50, −57, −74, −108 and −195 ms, and SD: 14, 24, 45, 85 and 163 ms), and (bottom) between the proposed correction and the IR spin-echo reference (from left to right, mean difference: −21, −22, −26, −26 and −41 ms, and SD: 11, 10, 12, 11 and 19 ms) for various delays. B. Bland-Altman plots comparing ROI-analyzed phantom T1 values between motion-resolved model-based reconstruction with different regularizations and the IR spin-echo reference (from left to right, mean difference: −31, −31 and −31 ms, and SD: 12, 12 and 12 ms).
Supporting Information Figure S2. (Top) One of the “end-diastolic” images (28th of 32) of a simulated dynamic image series and (middle and bottom) the corresponding horizontal profiles (dashed line in the top) through the motion dimension. The image series were reconstructed using the motion-resolved image reconstruction with different regularization type.
Supporting Information Figure S3. Two repeated myocardial T1 maps (end-expiration, end-diastolic) of the motion-resolved model-based reconstruction acquired during free breathing in comparison to MOLLI acquired in a breathhold for all eleven subjects.
Supporting Information Figure S4. Bland-Altman plots comparing ROI-analyzed mid-ventricular septal mean T1 values between the proposed correction and the Look-Locker correction for all subjects and scans. The mean difference is 24 ms and SD is 8 ms.
Supporting Information Figure S5. A. Representative diastolic T1 maps of basal, mid and apical short-axis slices reconstructed with the motion-resolved model-based reconstruction (free breathing) for two healthy subjects. B. Bullseye plots of (top) six basal segments and (bottom) four apical segments, showing the mean diastolic T1 values for six subjects for (left) the motion-resolved model-based reconstruction acquired during free breathing and (right) the MOLLI reference acquired in a breathhold. C. Bland Altman plots comparing (top) the mean diastolic T1 values of all six basal segments (mean difference: −15 ms, SD: 45 ms) and the two basal septal segments (segments 2 and 3 according to AHA, mean difference: 9 ms, SD: 42 ms), and (bottom) the mean diastolic T1 values of all apical segments (mean difference: −3 ms, SD: 71 ms) and the one apical septal segment (segment 14 according to AHA, mean difference: 42 ms, SD: 40 ms) for the proposed method and MOLLI for six subjects.
Supporting Information Figure S6. Free-breathing systolic and diastolic myocardial T1 maps reconstructed with the motion-resolved model-based reconstruction and their comparison to the MOLLI reference for a pig experiment. The ROI-analyzed mean T1 values (ms) and CoV values (%) for all the mid-ventricular AHA segments are presented in the bottom.
Supporting Information Table S1. T1 relaxation times (ms, mean ± SD) and CoV values (%) for the experimental phantom in Figure 2.
Supporting Information Table S2. T1 relaxation times (ms, mean ± SD) and CoV values (%) for the experimental phantom in Figure 3.
Supporting Information Table S3. The P-value of paired t-test comparison of the proposed free-breathing diastolic T1 values and MOLLI T1 values in each AHA segment.
Supporting Information Table S4. The relative difference (%) of the left-ventricular area between end-diastolic and end-systolic mid-ventricular myocardial T1 maps for all subjects and scans.
Supporting Information Video S2. Synthesized T1-weighted image series (bright blood and dark blood) and the corresponding myocardial T1 maps through the cardiac phase dimension for subject #3.
Supporting Information Video S3. Synthesized T1-weighted image series at temporal resolution of 49 ms for all inversion times and all cardiac phases of subject #2.
Acknowledgements
We thank Dr. Haikun Qi from ShanghaiTech University for insightful discussions.
This work was supported by the DZHK (German Centre for Cardiovascular Research), by the Deutsche Forschungsgemeinschaft (DFG, German Research Foundation) grants - UE 189/1–1, UE 189/4–1, TA 1473/2–1, and EXC 2067/1– 390729940, and funded in part by NIH under grant U24EB029240. This project has also received funding from the European Union’s Horizon 2020 research and innovation program under grant agreement No. 874764.
Appendix I: IRGNM-ADMM algorithm

In the above algorithm, contains the following three proximal operators:
and is the least-square proximal operator, i.e.,
Footnotes
Conflict of Interest
The authors declare no competing interests.
Part of this work has been presented at the ISMRM Annual Conference 2021 (Virtual).
Data Availability Statement
In the spirit of reproducible research, code to reproduce the experiments will be available on https://github.com/mrirecon/motion-resolved-myocardial-T1-mapping. The raw k-space data, all ROIs to reproduce the quantitative values and other relevant files used in this study can be downloaded from https://doi.org/10.5281/zenodo.5707688.
References
- [1].Moon JC, Messroghli DR, Kellman P, Piechnik SK, Robson MD, Ugander M, Gatehouse PD, Arai AE, Friedrich MG, Neubauer S et al. Myocardial T1 mapping and extracellular volume quantification: a Society for Cardiovascular Magnetic Resonance (SCMR) and CMR Working Group of the European Society of Cardiology consensus statement. J. Cardiovasc. Magn. Reson. 2013; 15:92. [DOI] [PMC free article] [PubMed] [Google Scholar]
- [2].Kellman P, Hansen MS. T1-mapping in the heart: accuracy and precision. J. Cardiovasc. Magn. Reson. 2014; 16:2. [DOI] [PMC free article] [PubMed] [Google Scholar]
- [3].Puntmann VO, Voigt T, Chen Z, Mayr M, Karim R, Rhode K, Pastor A, CarrWhite G, Razavi R, Schaeffter T et al. Native T1 mapping in differentiation of normal myocardium from diffuse disease in hypertrophic and dilated cardiomyopathy. JACC: Cardiovascular Imaging 2013; 6:475–484. [DOI] [PubMed] [Google Scholar]
- [4].Messroghli DR, Radjenovic A, Kozerke S, Higgins DM, Sivananthan MU, Ridgway JP. Modified Look-Locker Inversion recovery (MOLLI) for high-resolution T1 mapping of the heart. Magn. Reson. Med. 2004; 52:141–146. [DOI] [PubMed] [Google Scholar]
- [5].Chow K, Flewitt JA, Green JD, Pagano JJ, Friedrich MG, Thompson RB. Saturation recovery single-shot acquisition (SASHA) for myocardial T1 mapping. Magn. Reson. Med. 2014; 71:2082–2095. [DOI] [PubMed] [Google Scholar]
- [6].Weingärtner S, Ak akaya M, Basha T, Kissinger KV, Goddu B, Berg S, Manning WJ, Nezafat R. Combined saturation/inversion recovery sequences for improved evaluation of scar and diffuse fibrosis in patients with arrhythmia or heart rate variability. Magn. Reson. Med. 2014; 71:1024–1034. [DOI] [PubMed] [Google Scholar]
- [7].Piechnik SK, Ferreira VM, Dall’Armellina E, Cochlin LE, Greiser A, Neubauer S, Robson MD. Shortened Modified Look-Locker Inversion recovery (ShMOLLI) for clinical myocardial T1-mapping at 1.5 and 3 T within a 9 heartbeat breathhold. J. Cardiov. Magn. Reson. 2010; 12:1. [DOI] [PMC free article] [PubMed] [Google Scholar]
- [8].Gensler D, Mörchel P, Fidler F, Ritter O, Quick HH, Ladd ME, Bauer WR, Ertl G, Jakob PM, Nordbeck P. Myocardial T1 quantification by using an ECG-triggered radial single-shot inversion-recovery MR imaging sequence. Radiology 2014; 274:879–887. [DOI] [PubMed] [Google Scholar]
- [9].Wang X, Joseph AA, Kalentev O, Merboldt KD, Voit D, Roeloffs VB, van Zalk M, Frahm J. High-resolution myocardial T1 mapping using single-shot inversion recovery fast low-angle shot MRI with radial undersampling and iterative reconstruction. Brit. J. Radiol. 2016; 89:20160255. [DOI] [PMC free article] [PubMed] [Google Scholar]
- [10].Marty B, Coppa B, Carlier PG. Fast, precise, and accurate myocardial T1 mapping using a radial MOLLI sequence with FLASH readout. Magn. Reson. Med. 2018; 79:1387–1398. [DOI] [PubMed] [Google Scholar]
- [11].Hamilton JI, Jiang Y, Chen Y, Ma D, Lo WC, Griswold M, Seiberlich N. MR fingerprinting for rapid quantification of myocardial T1, T2, and proton spin density. Magn. Reson. Med. 2017; 77:1446–1458. [DOI] [PMC free article] [PubMed] [Google Scholar]
- [12].Jaubert O, Cruz G, Bustin A, Hajhosseiny R, Nazir S, Schneider T, Koken P, Doneva M, Rueckert D, Masci PG et al. T1, T2, and fat fraction cardiac MR fingerprinting: preliminary clinical evaluation. J. Magn. Reson. Imaging 2021; 53:1253–1265. [DOI] [PubMed] [Google Scholar]
- [13].Liu Y, Hamilton J, Eck B, Griswold M, Seiberlich N. Myocardial T1 and T2 quantification and water–fat separation using cardiac MR fingerprinting with rosette trajectories at 3T and 1.5 T. Magnetic Resonance in Medicine 2021; 85:103–119. [DOI] [PMC free article] [PubMed] [Google Scholar]
- [14].Lima da Cruz GJ, Velasco C, Lavin B, Jaubert O, Botnar RM, Prieto C. Myocardial T1, T2, T2*, and fat fraction quantification via low-rank motion-corrected cardiac MR fingerprinting. Magn. Reson. Med. 2022; DOI: 10.1002/mrm.29171. [DOI] [PMC free article] [PubMed] [Google Scholar]
- [15].Christodoulou AG, Shaw JL, Nguyen C, Yang Q, Xie Y, Wang N, Li D. Magnetic resonance multitasking for motion-resolved quantitative cardiovascular imaging. Nat. Biomed. Eng. 2018; 2:215. [DOI] [PMC free article] [PubMed] [Google Scholar]
- [16].Shaw JL, Yang Q, Zhou Z, Deng Z, Nguyen C, Li D, Christodoulou AG. Free-breathing, non-ECG, continuous myocardial T1 mapping with cardiovascular magnetic resonance multitasking. Magn. Reson. Med. 2019; 81:2450–2463. [DOI] [PMC free article] [PubMed] [Google Scholar]
- [17].Qi H, Jaubert O, Bustin A, Cruz G, Chen H, Botnar R, Prieto C. Free-running 3D whole heart myocardial T1 mapping with isotropic spatial resolution. Magn. Reson. Med. 2019; 82:1331–1342. [DOI] [PMC free article] [PubMed] [Google Scholar]
- [18].Guo R, Cai X, Kucukseymen S, Rodriguez J, Paskavitz A, Pierce P, Goddu B, Nezafat R. Free-breathing whole-heart multi-slice myocardial T1 mapping in 2 minutes. Magn. Reson. Med. 2021; 85:89–102. [DOI] [PubMed] [Google Scholar]
- [19].Zhou R, Weller DS, Yang Y, Wang J, Jeelani H, MuglerIII JP, Salerno M. Dual-excitation flip-angle simultaneous cine and T1 mapping using spiral acquisition with respiratory and cardiac self-gating. Magn. Reson. Med. 2021; 86:82–96. [DOI] [PMC free article] [PubMed] [Google Scholar]
- [20].Block KT, Uecker M, Frahm J. Model-Based Iterative Reconstruction for Radial Fast Spin-Echo MRI. IEEE Trans. Med. Imaging 2009; 28:1759–1769. [DOI] [PubMed] [Google Scholar]
- [21].Fessler JA. Model-based image reconstruction for MRI. IEEE Signal Process. Mag. 2010; 27:81–89. [DOI] [PMC free article] [PubMed] [Google Scholar]
- [22].Wang X, Tan Z, Scholand N, Roeloffs V, Uecker M. Physics-based reconstruction methods for magnetic resonance imaging. Philos. Trans. R. Soc. A 2021; 379:20200196. [DOI] [PMC free article] [PubMed] [Google Scholar]
- [23].Zhao B, Lam F, Liang Z. Model-Based MR Parameter Mapping With Sparsity Constraints: Parameter Estimation and Performance Bounds. IEEE Trans. Med. Imaging 2014; 33:1832–1844. [DOI] [PMC free article] [PubMed] [Google Scholar]
- [24].Wang X, Roeloffs V, Klosowski J, Tan Z, Voit D, Uecker M, Frahm J. Model-based T1 mapping with sparsity constraints using single-shot inversion-recovery radial FLASH. Magn. Reson. Med. 2018; 79:730–740. [DOI] [PubMed] [Google Scholar]
- [25].Maier O, Schoormans J, Schloegl M, Strijkers GJ, Lesch A, Benkert T, Block T, Coolen BF, Bredies K, Stollberger R. Rapid T1 quantification from high resolution 3D data with model-based reconstruction. Magn. Reson. Med. 2019; 81:2072–2089. [DOI] [PMC free article] [PubMed] [Google Scholar]
- [26].Becker KM, SchulzMenger J, Schaeffter T, Kolbitsch C. Simultaneous high-resolution cardiac T1 mapping and cine imaging using model-based iterative image reconstruction. Magn. Reson. Med. 2019; 81:1080–1091. [DOI] [PubMed] [Google Scholar]
- [27].Wang X, Kohler F, UnterbergBuchwald C, Lotz J, Frahm J, Uecker M. Model-based myocardial T1 mapping with sparsity constraints using single-shot inversion-recovery radial FLASH cardiovascular magnetic resonance. J. Cardiovasc. Magn. Reson. 2019; 21:60. [DOI] [PMC free article] [PubMed] [Google Scholar]
- [28].Rosenzweig S, Scholand N, Holme HCM, Uecker M. Cardiac and Respiratory Self-Gating in Radial MRI using an Adapted Singular Spectrum Analysis (SSA-FARY). IEEE Trans. Med. Imaging 2020; 39:3029–3041. [DOI] [PubMed] [Google Scholar]
- [29].Wundrak S, Paul J, Ulrici J, Hell E, Geibel MA, Bernhardt P, Rottbauer W, Rasche V. Golden ratio sparse MRI using tiny golden angles. Magn. Reson. Med. 2016; 75:2372–2378. [DOI] [PubMed] [Google Scholar]
- [30].Wang X, Rosenzweig S, Scholand N, Holme HCM, Uecker M. Model-based reconstruction for simultaneous multi-slice T1 mapping using single-shot inversion-recovery radial FLASH. Magn. Reson. Med. 2021; 85:1258–1271. [DOI] [PMC free article] [PubMed] [Google Scholar]
- [31].Feng L, Liu F, Soultanidis G, Liu C, Benkert T, Block KT, Fayad ZA, Yang Y. Magnetization-prepared GRASP MRI for rapid 3D T1 mapping and fat/water-separated T1 mapping. Magn. Reson. Med. 2021; 86:97–114. [DOI] [PMC free article] [PubMed] [Google Scholar]
- [32].Look DC, Locker DR. Time saving in measurement of NMR and EPR relaxation times. Rev. Sci. Instrum. 1970; 41:250–251. [Google Scholar]
- [33].Deichmann R, Haase A. Quantification of T1 values by SNAPSHOT-FLASH NMR imaging. J. Magn. Reson. (1969) 1992; 96:608–612. [Google Scholar]
- [34].Larson AC, White RD, Laub G, McVeigh ER, Li D, Simonetti OP. Self-gated cardiac cine MRI. Magn. Reson. Med. 2004; 51:93–102. [DOI] [PMC free article] [PubMed] [Google Scholar]
- [35].Winter P, Kampf T, Helluy X, Gutjahr FT, Meyer CB, Bauer WR, Jakob PM, Herold V. Self-navigation under non-steady-state conditions: Cardiac and respiratory self-gating of inversion recovery snapshot FLASH acquisitions in mice. Magn. Reson. Med. 2016; 76:1887–1894. [DOI] [PubMed] [Google Scholar]
- [36].Rosenzweig S, Uecker M. Novel insights on SSA-FARY: Amplitude-based respiratory binning in self-gated cardiac MRI. In: Proc. Intl. Soc. Mag. Reson. Med, Virtual, 2021. p. 1956. [Google Scholar]
- [37].Feng L, Axel L, Chandarana H, Block KT, Sodickson DK, Otazo R. XD-GRASP: Golden-angle radial MRI with reconstruction of extra motion-state dimensions using compressed sensing. Magn. Reson. Med. 2016; 75:775–788. [DOI] [PMC free article] [PubMed] [Google Scholar]
- [38].Uecker M, Hohage T, Block KT, Frahm J. Image reconstruction by regularized nonlinear inversion-joint estimation of coil sensitivities and image content. Magn. Reson. Med. 2008; 60:674–682. [DOI] [PubMed] [Google Scholar]
- [39].Bakushinsky AB, Kokurin MY, “Iterative Methods for Approximate Solution of Inverse Problems”, Mathematics and Its Applications. Springer Science & Business Media, 2005. [Google Scholar]
- [40].Boyd S, Parikh N, Chu E, Peleato B, Eckstein J. Distributed Optimization and Statistical Learning via the Alternating Direction Method of Multipliers. Found. Trends Mach. Learn. 2011; 3:1–122. [Google Scholar]
- [41].Roeloffs V, Voit D, Frahm J. Spoiling without additional gradients: Radial FLASH MRI with randomized radiofrequency phases. Magn. Reson. Med. 2016; 75:2094–2099. [DOI] [PubMed] [Google Scholar]
- [42].Barral JK, Gudmundson E, Stikov N, EtezadiAmoli M, Stoica P, Nishimura DG. A robust methodology for in vivo T1 mapping. Magn. Reson. Med. 2010; 64:1057–1067. [DOI] [PMC free article] [PubMed] [Google Scholar]
- [43].Kellman P, Herzka DA, Hansen MS. Adiabatic inversion pulses for myocardial T1 mapping. Magn. Reson. Med. 2014; 71:1428–1434. [DOI] [PMC free article] [PubMed] [Google Scholar]
- [44].Uecker M, Ong F, Tamir JI, Bahri D, Virtue P, Cheng JY, Zhang T, Lustig M. Berkeley advanced reconstruction toolbox. In: Proc. Intl. Soc. Mag. Reson. Med, Toronto, 2015. p. 2486. [Google Scholar]
- [45].Rosenzweig S, Holme HCM, Uecker M. Simple auto-calibrated gradient delay estimation from few spokes using Radial Intersections (RING). Magn. Reson. Med. 2019; 81:1898–1906. [DOI] [PubMed] [Google Scholar]
- [46].Uecker M, Zhang S, Frahm J. Nonlinear inverse reconstruction for real-time MRI of the human heart using undersampled radial FLASH. Magn. Reson. Med. 2010; 63:1456–1462. [DOI] [PubMed] [Google Scholar]
- [47].Pearson TA, Blair SN, Daniels SR, Eckel RH, Fair JM, Fortmann SP, Franklin BA, Goldstein LB, Greenland P, Grundy SM et al. AHA guidelines for primary prevention of cardiovascular disease and stroke: 2002 update: consensus panel guide to comprehensive risk reduction for adult patients without coronary or other atherosclerotic vascular diseases. Circulation 2002; 106:388–391. [DOI] [PubMed] [Google Scholar]
- [48].Sumpf T, Unterberger M. arrayshow: a guide to an open source matlab tool for complex MRI data analysis. In: Proc. Intl. Soc. Mag. Reson. Med., Salt Lake City, 2013. p. 2719. [Google Scholar]
- [49].von KnobelsdorffBrenkenhoff F, Prothmann M, Dieringer MA, Wassmuth R, Greiser A, Schwenke C, Niendorf T, SchulzMenger J. Myocardial T1 and T2 mapping at 3 T: reference values, influencing factors and implications. J. Cardiovasc. Magn. Reson. 2013; 15:1–11. [DOI] [PMC free article] [PubMed] [Google Scholar]
- [50].Hermann I, Uhrig T, ChaconCaldera J, Ak akaya M, Schad LR, Weingärtner S. Towards measuring the effect of flow in blood T1 assessed in a flow phantom and in vivo. Phys. Med. Biol. 2020; 65:095001. [DOI] [PubMed] [Google Scholar]
- [51].TranGia J, Wech T, Hahn D, Bley TA, Köstler H. Consideration of slice profiles in inversion recovery Look–Locker relaxation parameter mapping. Magn. Reson. Imaging 2014; 32:1021–1030. [DOI] [PubMed] [Google Scholar]
- [52].Serry FM, Ma S, Mao X, Han F, Xie Y, Han H, Li D, Christodoulou AG. Dual flip-angle IR-FLASH with spin history mapping for B1+ corrected T1 mapping: Application to T1 cardiovascular magnetic resonance multitasking. Magn. Reson. Med. 2021; 86:3182–3191. [DOI] [PMC free article] [PubMed] [Google Scholar]
- [53].Cheng JY, Hanneman K, Zhang T, Alley MT, Lai P, Tamir JI, Uecker M, Pauly JM, Lustig M, Vasanawala SS. Comprehensive motion-compensated highly accelerated 4D flow MRI with ferumoxytol enhancement for pediatric congenital heart disease. J. Magn. Reson. Imaging 2016; 43:1355–1368. [DOI] [PMC free article] [PubMed] [Google Scholar]
- [54].Cheng JY, Zhang T, Alley MT, Uecker M, Lustig M, Pauly JM, Vasanawala SS. Comprehensive Multi-Dimensional MRI for the Simultaneous Assessment of Cardiopulmonary Anatomy and Physiology. Sci. Rep. 2017; 7:5330. [DOI] [PMC free article] [PubMed] [Google Scholar]
- [55].DiSopra L, Piccini D, Coppo S, Stuber M, Yerly J. An automated approach to fully self-gated free-running cardiac and respiratory motion-resolved 5D whole-heart MRI. Magn. Reson. Med. 2019; 82:2118–2132. [DOI] [PubMed] [Google Scholar]
- [56].Hansen MS, Sørensen TS, Arai AE, Kellman P. Retrospective reconstruction of high temporal resolution cine images from real-time MRI using iterative motion correction. Magn. Reson. Med. 2012; 68:741–750. [DOI] [PMC free article] [PubMed] [Google Scholar]
- [57].Qi H, Fuin N, Cruz G, Pan J, Kuestner T, Bustin A, Botnar RM, Prieto C. Non-rigid respiratory motion estimation of whole-heart coronary MR images using unsupervised deep learning. IEEE Trans. Med. Imaging 2020; 40:444–454. [DOI] [PubMed] [Google Scholar]
- [58].Hammernik K, Klatzer T, Kobler E, Recht MP, Sodickson DK, Pock T, Knoll F. Learning a variational network for reconstruction of accelerated MRI data. Magn. Reson. Med. 2018; 79:3055–3071. [DOI] [PMC free article] [PubMed] [Google Scholar]
Associated Data
This section collects any data citations, data availability statements, or supplementary materials included in this article.
Supplementary Materials
Supporting Information Video S1. Synthesized T1-weighted image series (bright blood and dark blood) and the corresponding myocardial T1 maps through the cardiac phase dimension for subject #2.
Supporting Information Figure S1. A. Bland-Altman plots comparing ROI-analyzed phantom T1 values (top) between the original Look-Locker correction and the IR spin-echo reference (from left to right, mean difference: −50, −57, −74, −108 and −195 ms, and SD: 14, 24, 45, 85 and 163 ms), and (bottom) between the proposed correction and the IR spin-echo reference (from left to right, mean difference: −21, −22, −26, −26 and −41 ms, and SD: 11, 10, 12, 11 and 19 ms) for various delays. B. Bland-Altman plots comparing ROI-analyzed phantom T1 values between motion-resolved model-based reconstruction with different regularizations and the IR spin-echo reference (from left to right, mean difference: −31, −31 and −31 ms, and SD: 12, 12 and 12 ms).
Supporting Information Figure S2. (Top) One of the “end-diastolic” images (28th of 32) of a simulated dynamic image series and (middle and bottom) the corresponding horizontal profiles (dashed line in the top) through the motion dimension. The image series were reconstructed using the motion-resolved image reconstruction with different regularization type.
Supporting Information Figure S3. Two repeated myocardial T1 maps (end-expiration, end-diastolic) of the motion-resolved model-based reconstruction acquired during free breathing in comparison to MOLLI acquired in a breathhold for all eleven subjects.
Supporting Information Figure S4. Bland-Altman plots comparing ROI-analyzed mid-ventricular septal mean T1 values between the proposed correction and the Look-Locker correction for all subjects and scans. The mean difference is 24 ms and SD is 8 ms.
Supporting Information Figure S5. A. Representative diastolic T1 maps of basal, mid and apical short-axis slices reconstructed with the motion-resolved model-based reconstruction (free breathing) for two healthy subjects. B. Bullseye plots of (top) six basal segments and (bottom) four apical segments, showing the mean diastolic T1 values for six subjects for (left) the motion-resolved model-based reconstruction acquired during free breathing and (right) the MOLLI reference acquired in a breathhold. C. Bland Altman plots comparing (top) the mean diastolic T1 values of all six basal segments (mean difference: −15 ms, SD: 45 ms) and the two basal septal segments (segments 2 and 3 according to AHA, mean difference: 9 ms, SD: 42 ms), and (bottom) the mean diastolic T1 values of all apical segments (mean difference: −3 ms, SD: 71 ms) and the one apical septal segment (segment 14 according to AHA, mean difference: 42 ms, SD: 40 ms) for the proposed method and MOLLI for six subjects.
Supporting Information Figure S6. Free-breathing systolic and diastolic myocardial T1 maps reconstructed with the motion-resolved model-based reconstruction and their comparison to the MOLLI reference for a pig experiment. The ROI-analyzed mean T1 values (ms) and CoV values (%) for all the mid-ventricular AHA segments are presented in the bottom.
Supporting Information Table S1. T1 relaxation times (ms, mean ± SD) and CoV values (%) for the experimental phantom in Figure 2.
Supporting Information Table S2. T1 relaxation times (ms, mean ± SD) and CoV values (%) for the experimental phantom in Figure 3.
Supporting Information Table S3. The P-value of paired t-test comparison of the proposed free-breathing diastolic T1 values and MOLLI T1 values in each AHA segment.
Supporting Information Table S4. The relative difference (%) of the left-ventricular area between end-diastolic and end-systolic mid-ventricular myocardial T1 maps for all subjects and scans.
Supporting Information Video S2. Synthesized T1-weighted image series (bright blood and dark blood) and the corresponding myocardial T1 maps through the cardiac phase dimension for subject #3.
Supporting Information Video S3. Synthesized T1-weighted image series at temporal resolution of 49 ms for all inversion times and all cardiac phases of subject #2.
Data Availability Statement
In the spirit of reproducible research, code to reproduce the experiments will be available on https://github.com/mrirecon/motion-resolved-myocardial-T1-mapping. The raw k-space data, all ROIs to reproduce the quantitative values and other relevant files used in this study can be downloaded from https://doi.org/10.5281/zenodo.5707688.