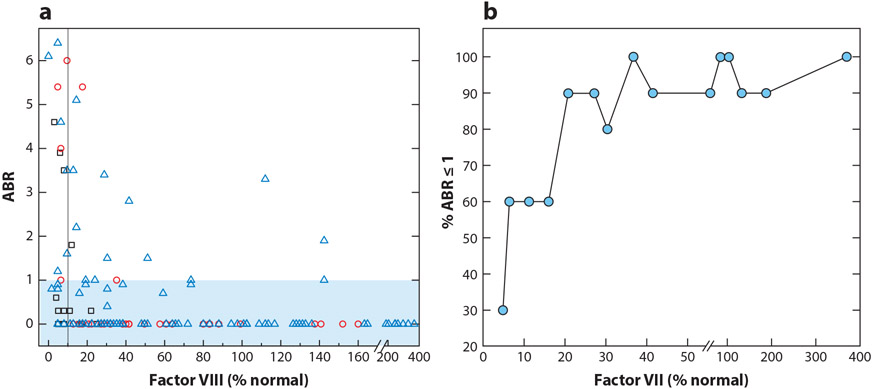
Figure 2.
Relationship between annualized bleeding rate (ABR) and factor VIII (FVIII) activity. (a) The ABR and FVIII activity for all gene therapy recipients of 0.5–2 × 10¹² vg/kg of SPK-8011 (black squares), 4–6 × 10¹³ vg/kg AAV5-FVIII phase I/II (red circles), and 6 × 10¹³ vg/kg AAV5-FVIII phase III (blue triangles). Plotted FVIII activity levels are determined by one-stage assay or converted from a chromogenic assay results using a correction factor of 1.6 (56, 58, 61, 104). The black vertical line represents 10% of normal FVIII level. The blue shaded box represents recipients with an ABR ≤1. (b) Percentage of gene therapy recipients with an ABR ≤1 as a function of their FVIII activity determined by one-state assay. Ascending ABR data from gene therapy recipients were binned into groups of 10 and then plotted as a function of the maximum FVIII level in the binned group.

