
Figure 6. T1 maps for all raw datasets at R = 12.
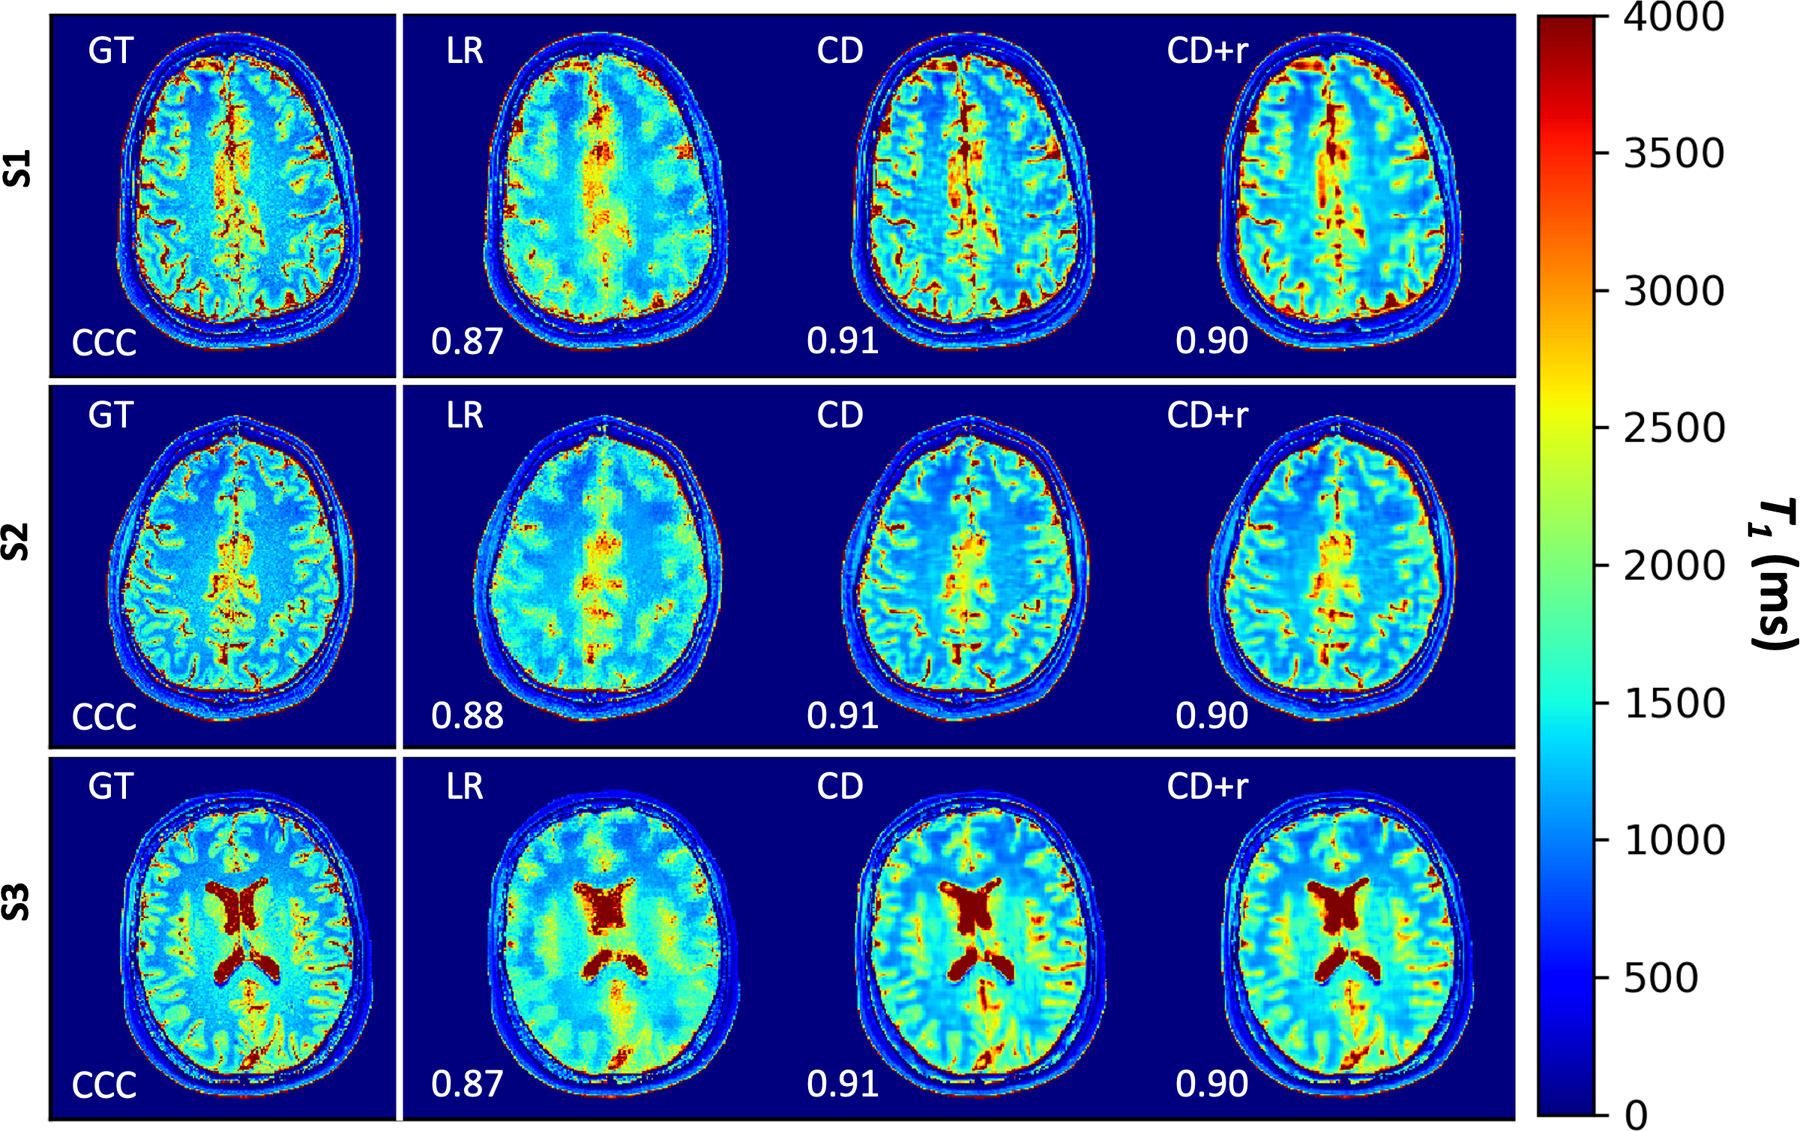
T1 maps for all three subjects corresponding to mapping the anatomical LR, CD, and CD+r reconstructions. The CD and CD+r () reconstructions for each subject are displayed after the optimal number of training steps specified in Table 1. For all values of R, the CD and CD+r T1 maps show less blurring in the grey matter regions as compared to the LR T1 maps. The CCC values, overlain on each map, are lower for the LR T1 maps for all subjects (≤0.88) as compared to the CD and CD+r T1 maps for all subjects (≥ 0.90).