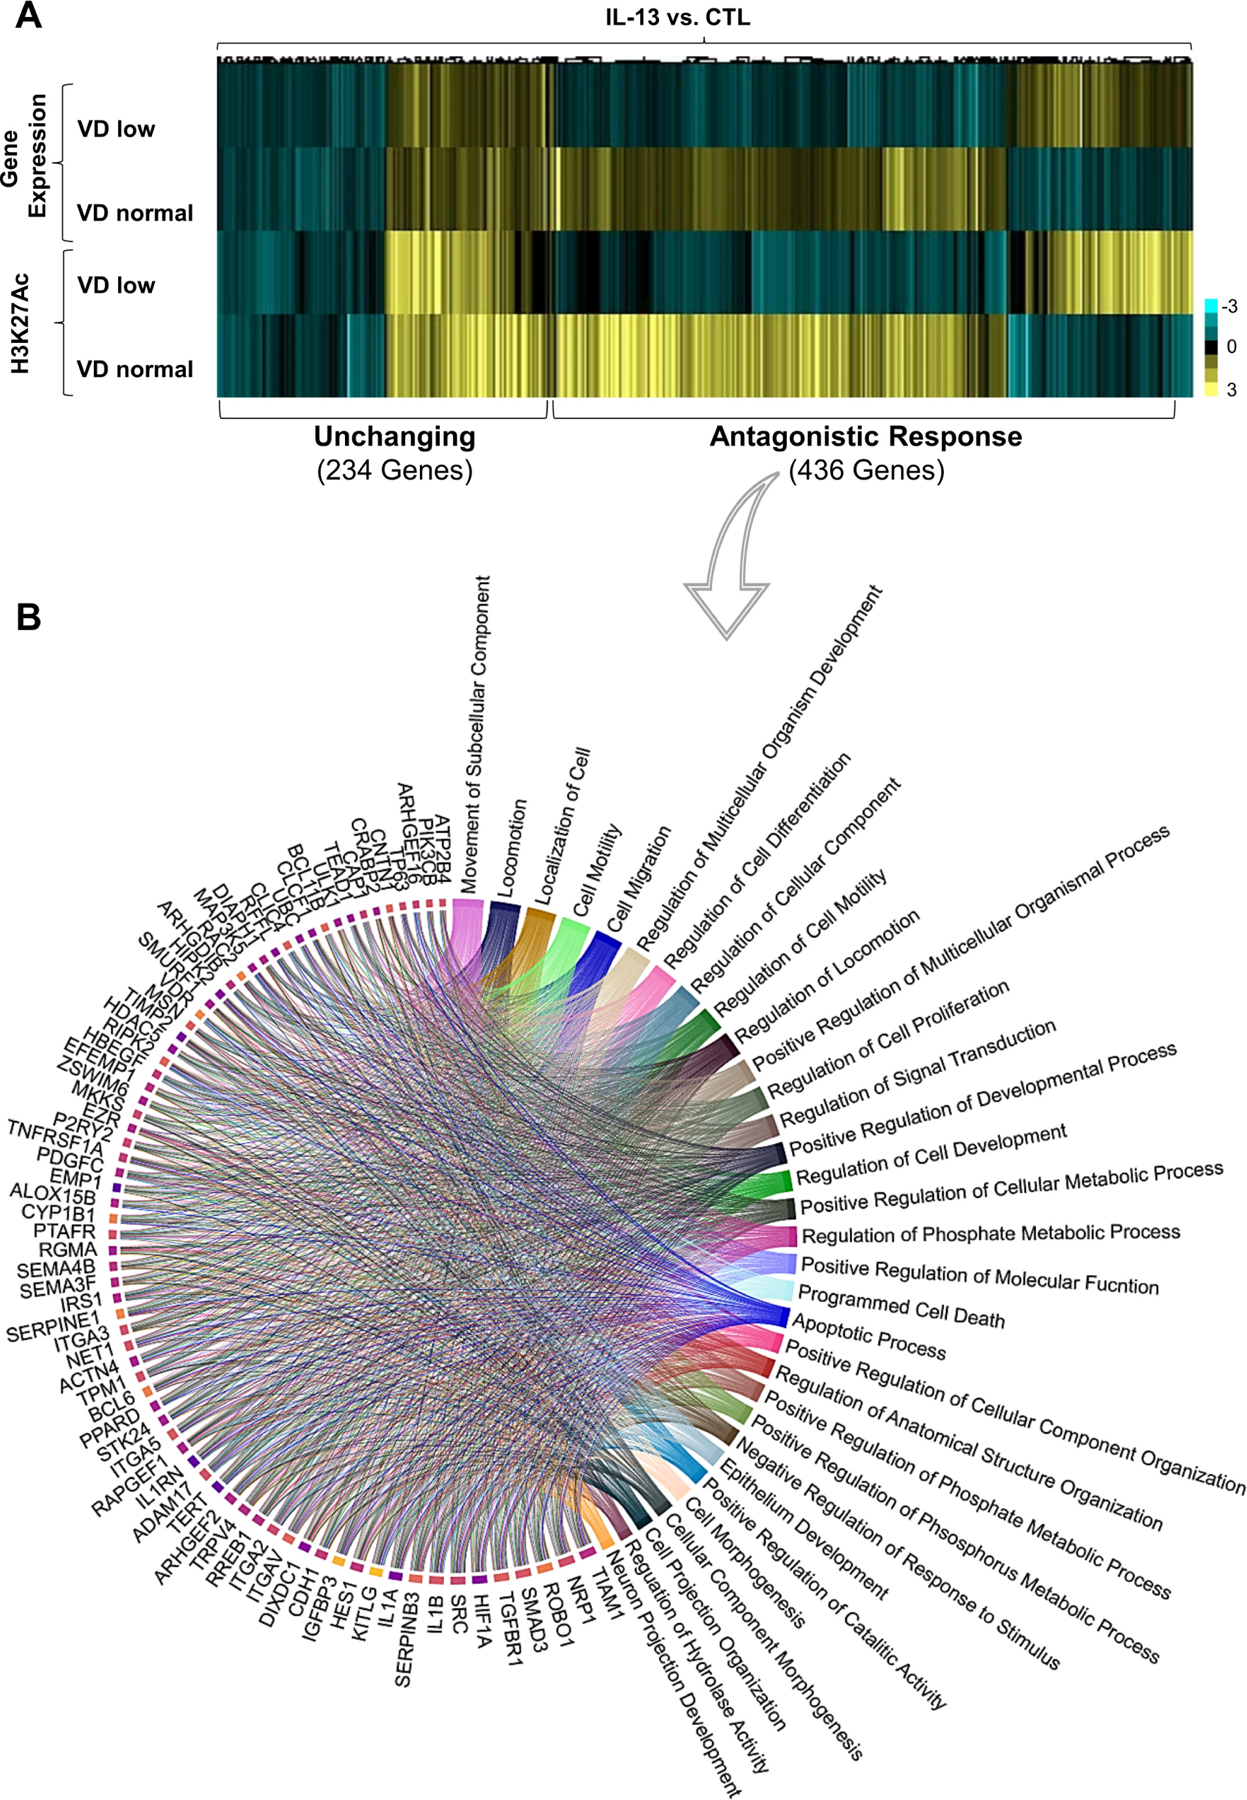
Figure 1.

Effect of vitamin D (VD) on IL-13-induced epithelial gene and epigenetic marks expression. (A, B) Superconfluent organotypic cultures of oesophageal epithelial cells were maintained for 2 days in serum-free medium alone (0.5 nM VD; VD low) and supplemented with low VD medium or medium containing 100 nM VD (VD normal) for 2 hours and then stimulated with IL-13 (100 ng/mL) or vehicle (medium; control (CTL)) for an additional 6 hours. (A) The heatmap of H3K27Ac and differentially expressed genes fold changes; genes containing VDR and/or STAT6 binding sites as determined in ChIPseq (online supplemental table 3) in cells treated with IL-13 and VD compared with cells treated with IL-13 alone. Clustering revealed two main groups of genes where transcription and epigenetic marks are affected (antagonistic response) or not affected (unchanging) by VD supplementation. (B) Circa-plot of antagonistic response genes. Genes were functionally assessed using gene ontology (GO) analysis, and the top 76 genes driving their corresponding biological function were plotted clockwise–from higher to lower number of pathways per gene. Data are a summary of n=3 independent experiments. Each data point is a mean measurement for expression of an individual gene or gene-associated epigenetic mark. Statistics of differentially expressed genes by DESEQ2 (false discovery rate (FDR)-adjusted p≤0.05; see the Methods section).
