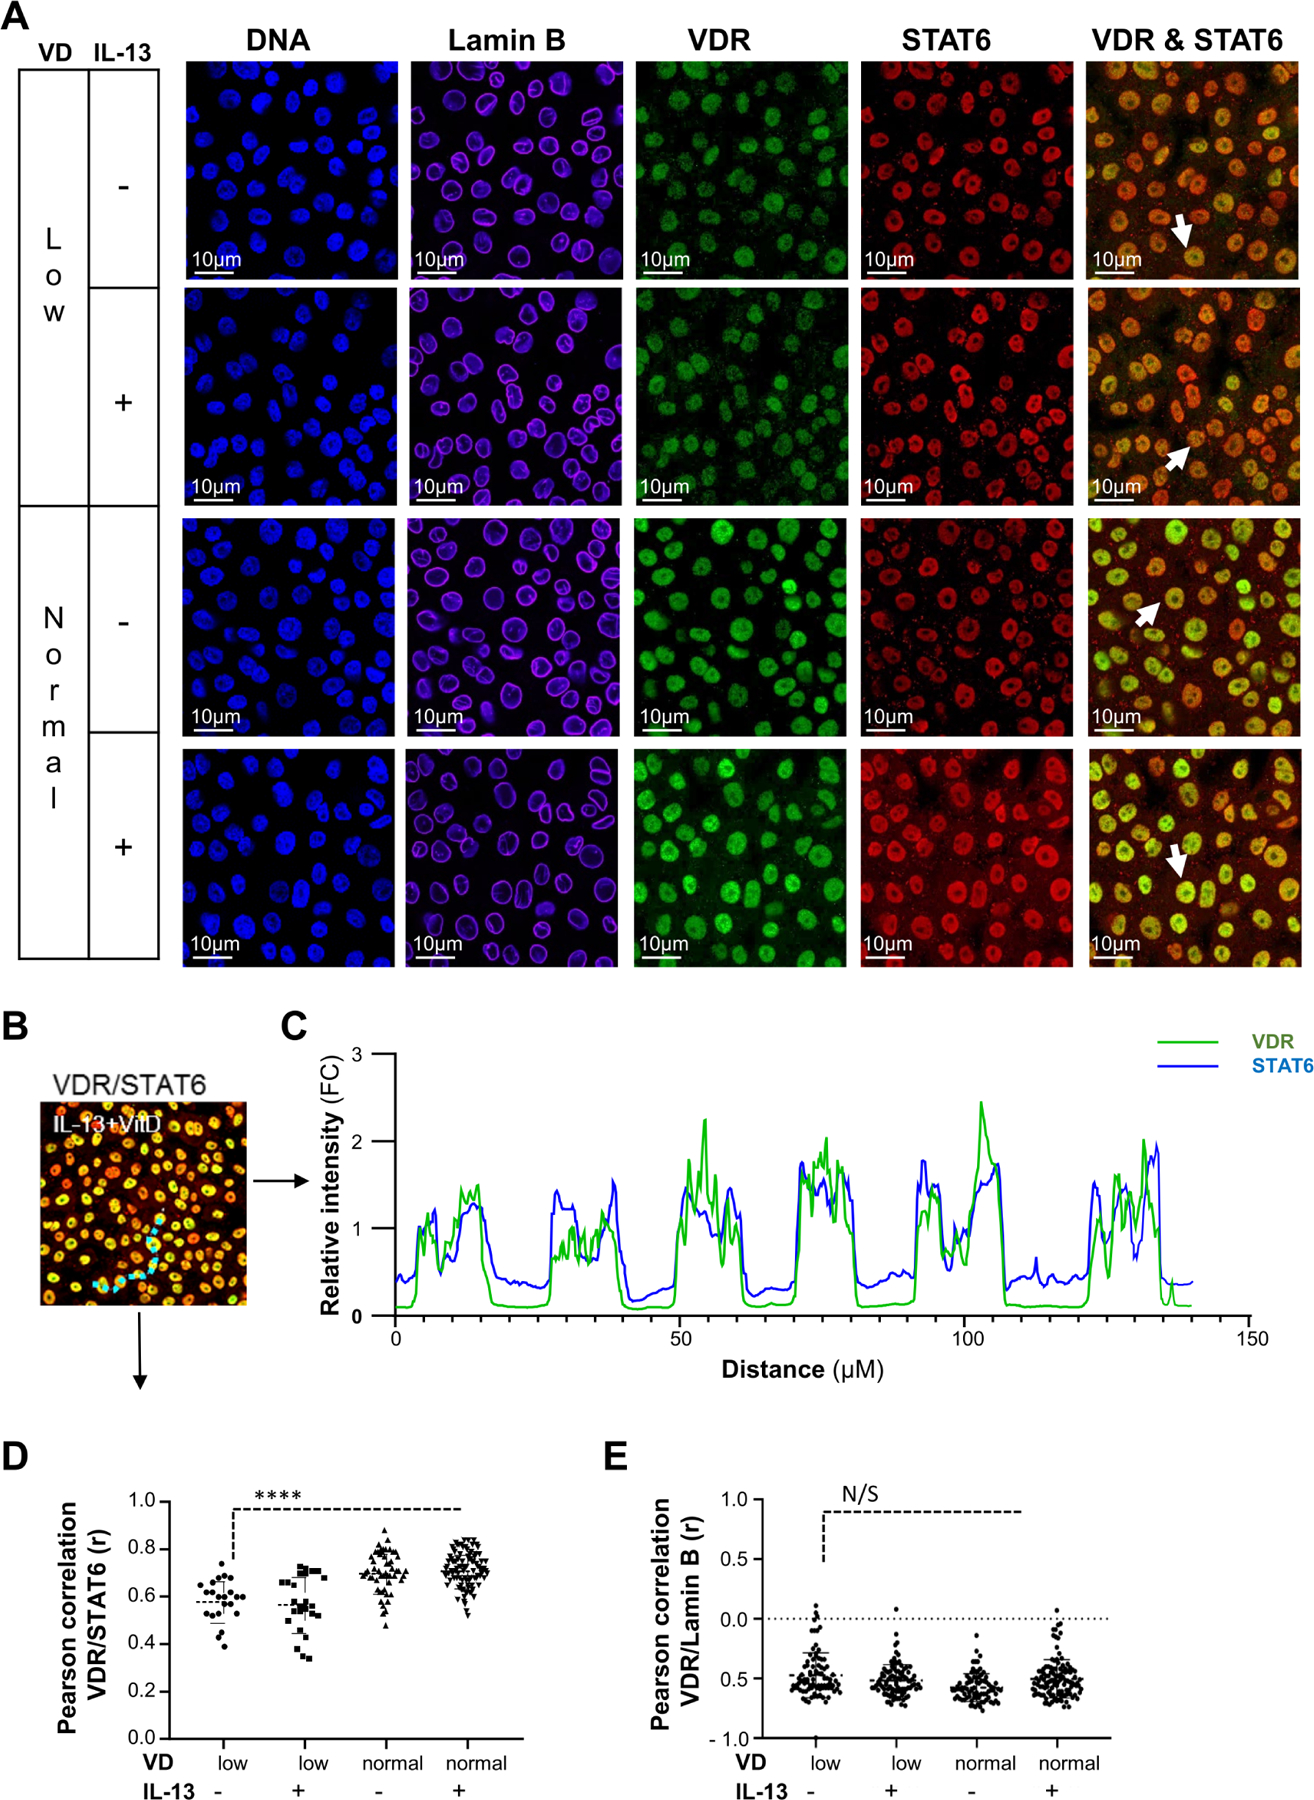
Figure 2.

Analysis of VDR and STAT6 colocalisation in cell nuclei. (A–E) Superconfluent organotypic cultures of oesophageal epithelial cells were maintained for 2 days in serum-free medium alone (0.5 nM VD; VD low) and supplemented with low VD medium or medium containing 100 nM VD (VD normal) for 2 hours and then stimulated with IL-13 (100 ng/mL) or vehicle (medium; control (CTL)) for an additional 6 hours. (A) Immunofluorescent detection of cell nuclei (DNA; DAPI), lamin B, VDR, and STAT6 or staining overlay (VDR & STAT6; indicated with arrowheads). (B) Representative image of VDR and STAT6 overlay in VD- and IL-13-treated cells. A dotted line (light blue) was drawn across six individual cell nuclei as an example of the nuclear colocalisation of VDR and STAT6. (C) Relative fluorescence intensity of any individual signal per pixel as a function of distance between six individual nuclei (B; dotted line). (D–E) Pearson correlation of VDR and STAT6 (D) or VDR and lamin B (E) colocalisation. Data are representative (A) or a summary (B–E) of n=3 independent experiments. Each data point is a mean of a technical duplicate ±SD of individual in vitro assays measurements. Statistics by one-way ANOVA with Tukey’s multiple comparisons test: ****p≤0.0001; ANOVA, analysis of variance; N/S, not significant; VDR, vitamin D receptor.
