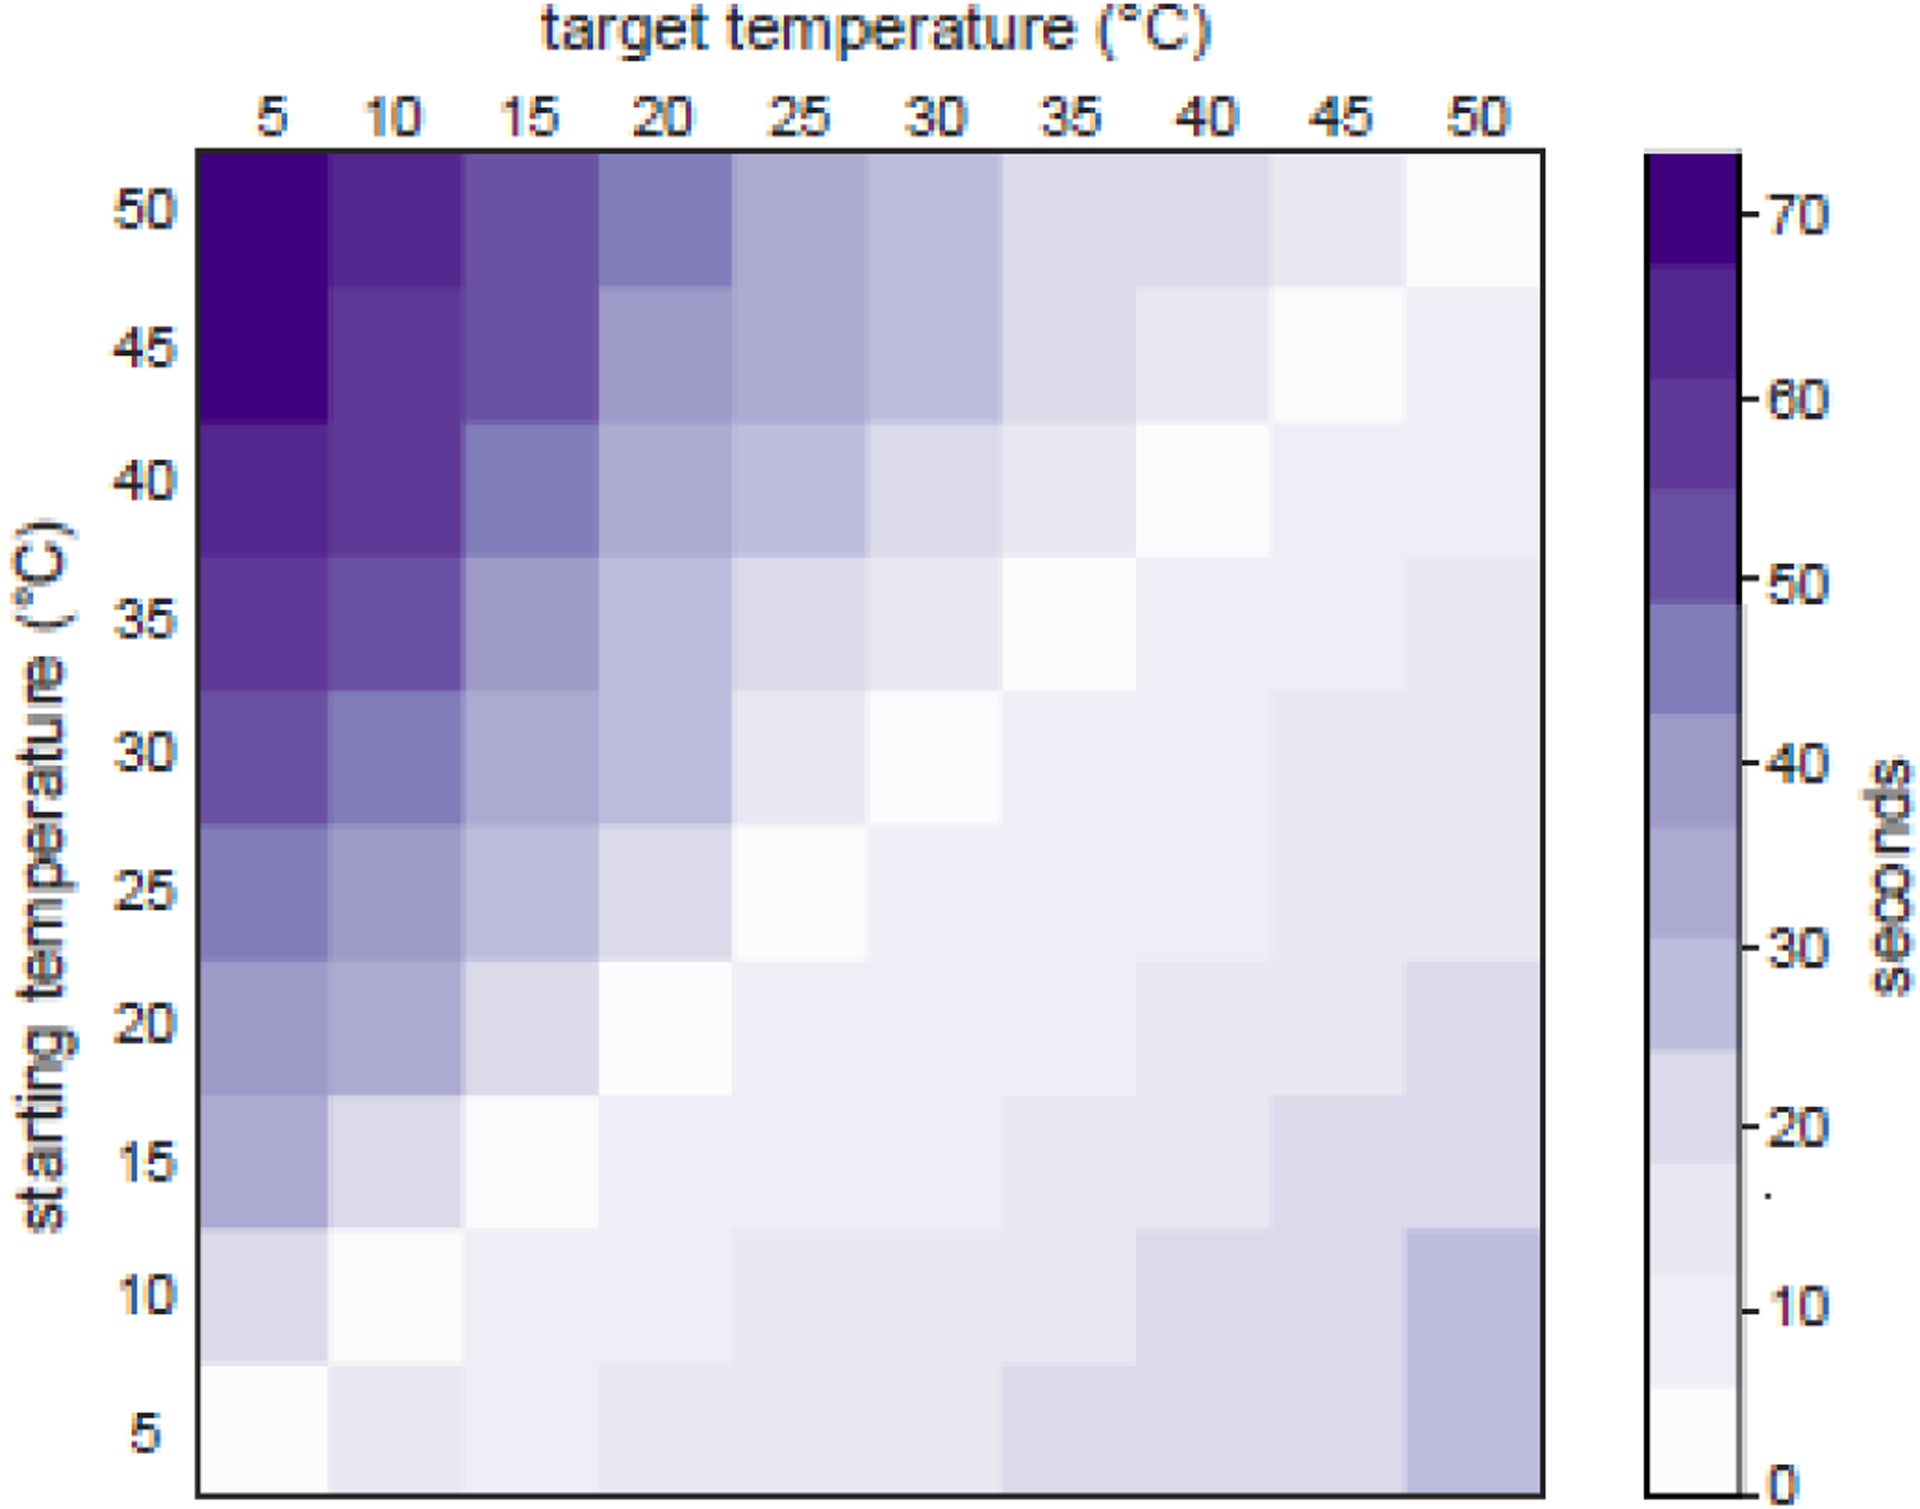
Figure 2.

Average time for the interface to adjust from a starting temperature to a target temperature. Temperatures between 5 and 50°C were tested. Lighter shades of purple represent faster adjustment times while darker shades represent longer adjustment times. Temperature adjustment was tested three times and the average time is shown.
