
FIGURE 3.
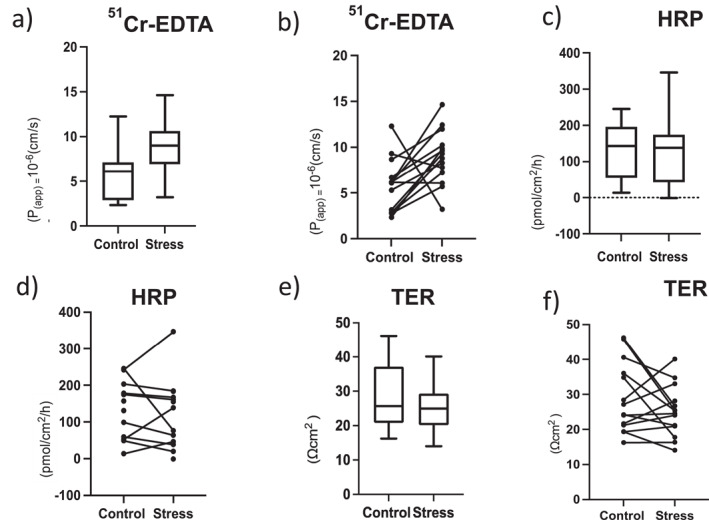
Assessment of barrier function in rectal mucosa in control and stress sessions. Results are presented as box plot and paired line chart (control and stress in same individual), respectively, for all variables. (a and b) Paracellular permeability studied using 51Cr‐EDTA (n = 16 subjects, 14 paired analyses, p = 0.0245); (c and d) Transcellular antigen passage studied using horseradish peroxidase (HRP) (n = 14 subjects, 8 paired analyses); (e and f) Transepithelial resistance (TER) (n = 12 subjects, 10 paired analyses). *p < 0.05