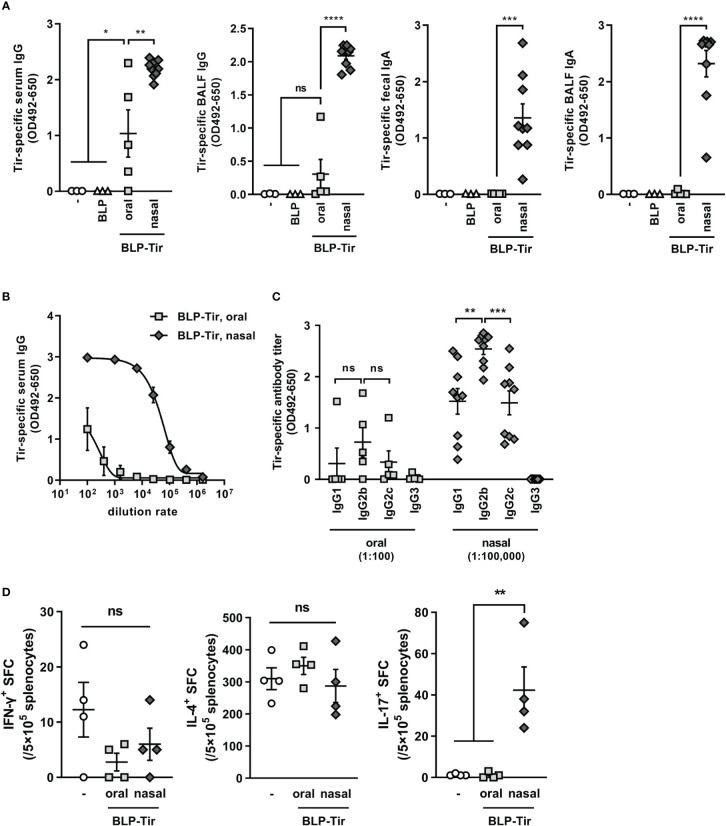
Figure 2.
Tir-specific humoral and cellular immune responses induced by oral or nasal administration of BLP-Tir. Mice were administered with BLP-Tir via the oral or nasal route for 3 consecutive days for 3 times (d0-2, d13-15, d27-29). (A) Tir-specific IgG and IgA in serum, BALF, and fecal extracts collected at d35 were measured. The dilution rate of serum, BALF and fecal extract were 1:100, 1:2, and 1:3, respectively. Data were expressed as the mean ± SEM (n=3-9). Each symbol represents an independent mouse. *, p<0.05; **, p<0.01; ***, p<0.001; and ****, p<0.0001; ns, not significant; one-way ANOVA followed by Tukey’s multiple comparison test. (B), Tir-specific serum IgG antibody titers of the same samples used in (A) were measured at various dilution rates. Data were expressed as the mean ± SEM (n=5-9). Some error bars are behind the symbols due to small variations. (C), Tir-specific IgG1, 2b, 2c, and 3 titers. Sera from mice orally administered with BLP-Tir (oral) were diluted 1:100 and those from mice nasally administered with BLP-Tir (nasal) were diluted 1:100,000 (n=5-9). Each symbol represents an independent mouse. **, p<0.01; ***, p<0.001; ns, not significant; one-way ANOVA followed by Tukey’s multiple comparison test. (D), Mice were orally or nasally immunized with BLP-Tir. Splenocytes were isolated 30 days after the last administration. The number of IFN-γ-, IL-4-, and IL-17-spot-forming cells (SFC) calculated from the ELISPOT assay after 30 μg/ml purified Tir stimulation in vitro. Data were expressed as the mean ± SEM (n=4). Each symbol represents an independent mouse. **, p<0.01; one-way ANOVA followed by Tukey’s multiple comparison test.

