Figure 4.
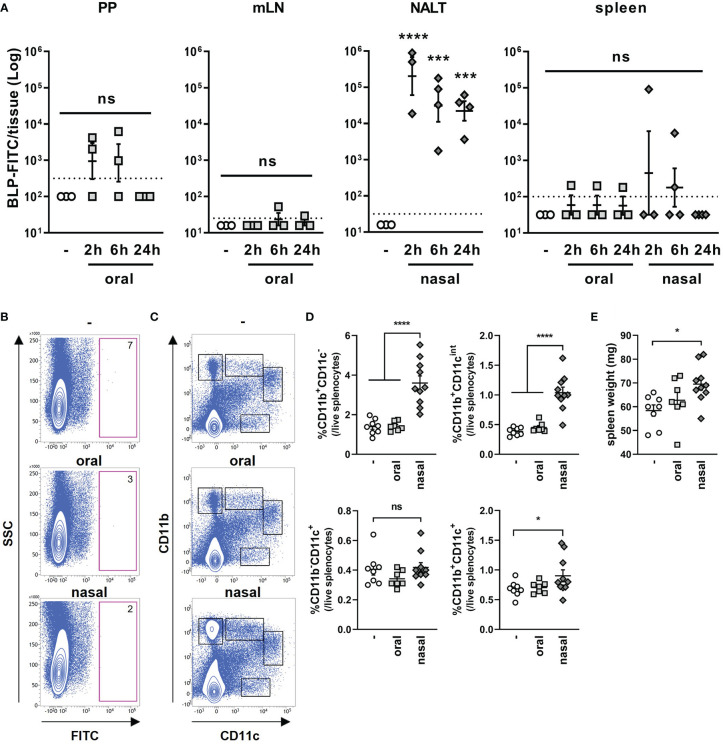
Dynamics of BLPs after oral and nasal administration. (A) The number of BLP-FITC conjugates in lymphoid tissues (PPs, mLNs, NALT and spleen) was determined by flow cytometry at 2, 6, or 24 h after oral or nasal administration of 2 × 10⁹ BLP-FITC. Data were expressed as the mean ± SEM (n=3-4). Each symbol represents an independent mouse. Dotted line indicates the detection limit. ***, p<0.001; ****, p<0.0001; one-way ANOVA followed by Tukey’s multiple comparison test. (B) Splenocytes were isolated at 6 h after the oral or nasal administration of BLP-FITC. Dead cells were gated out with FVD780 reagent. Representative images of each group are shown (n=3-6). The red frame boxes indicate the number of FITC+ cells in approximately 5 × 10⁵ live splenocytes. (C) Splenocytes isolated at 24 h after the oral or nasal administration of BLP-FITC were stained with antibodies to CD11b and CD11c. Dead cells were gated out with FVD780 reagent. At least 2.5 × 10⁵ live singlet cells were initially gated. Representative images of each group are shown (n=7-10). (D) Percentage of the populations is indicated with boxes in (C). *, p<0.05; ****, p<0.0001; ns, not significant; one-way ANOVA followed by Tukey’s multiple comparison test. (E) Spleen weight of mice at 24 h after the oral or nasal administration with BLP-FITC. *, p<0.05; one-way ANOVA followed by Tukey’s multiple comparison test.

