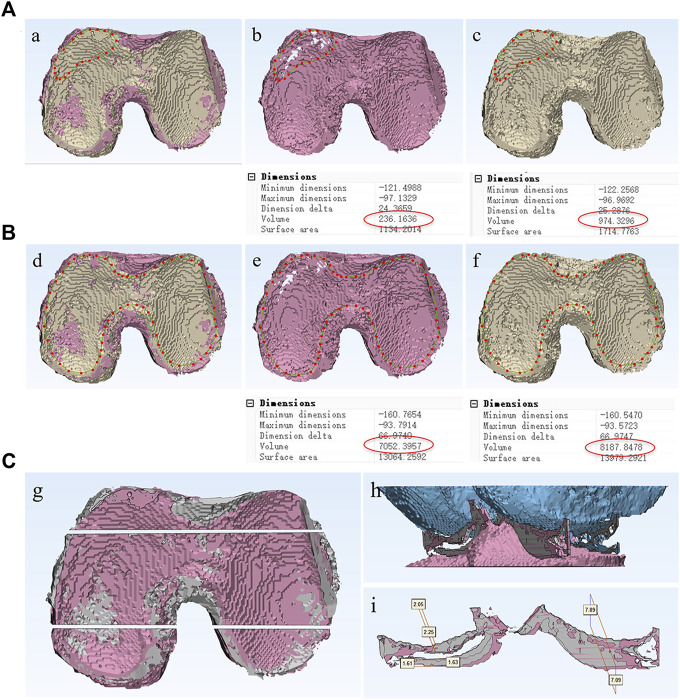
FIGURE 3.
Quantitative analysis method of articular cartilage at different time periods. Define the borderline of defect cartilage area (A) or entire articular cartilage area (B), and the volume changes between two different periods could be measured and compared. (C) The knee joint was coronal incised at the anterior and posterior positions, the cross-sectional area of cartilage, as well as the thickness of femoral cartilage and tibial cartilage at each position could be measured respectively.

