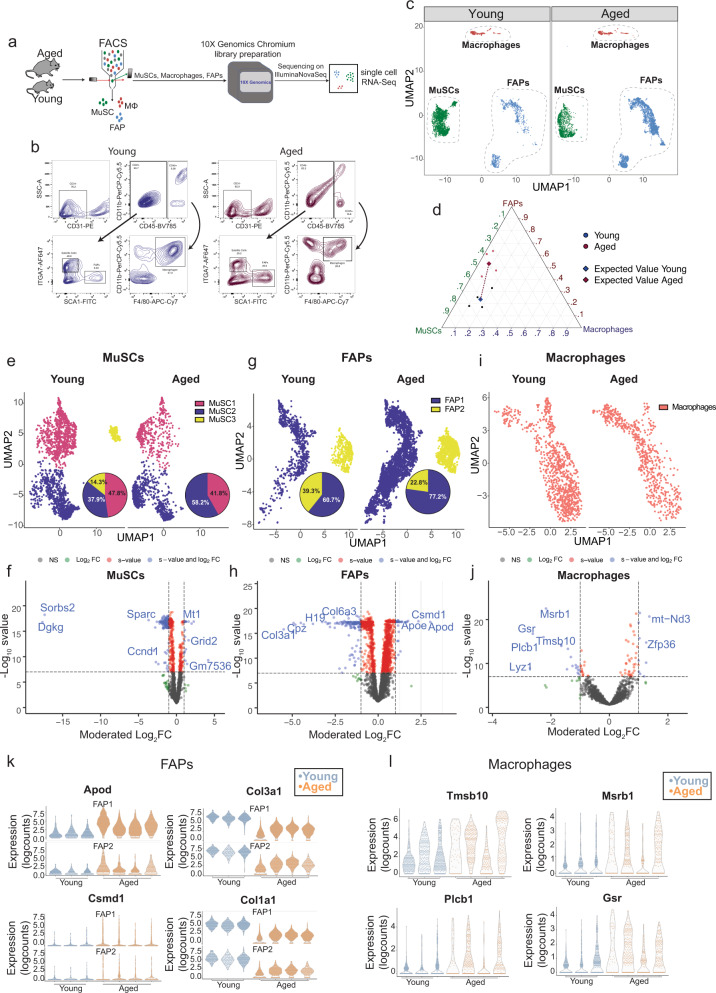
Fig. 1. The population dynamics of MuSCs and niche cells are altered in aging.
a Schematic diagram of the workflow for the isolation and single-cell RNA sequencing of young and aged MuSCs, macrophages and Fibro-Adipogenic Progenitors (FAPs).b Fluorescence-Activated Cell Sorting (FACS) plots demonstrating the strategy for the simultaneous isolation of MuSCs, macrophages and FAPs from young (5–6-week-old) and aged (24-month-old) mice.c, Global UMAP plot of scRNA-seq data from young and aged MuSCs, FAPs, and macrophages (n = 3 mice per group) d Dirichlet Regression analysis of the proportions of sequenced MuSCs, FAPs and macrophages from young and aged mice. The best-fitting model was selected based on the likelihood-ratio-test (p-value < 2.2e−16; See notebook at https://csglab.github.io/transcriptional_reprogramming_muscle_cells/). e UMAP plot of scRNA-seq data from young and aged MuSCs including pie charts showing the proportions of cells in each subpopulation. f Volcano plots showing genes that are up or downregulated due to aging in MuSCs at a threshold of moderated LFC > 1 and s-value < 0.05. g UMAP plot of scRNA-seq data from young and aged FAPs including pie charts showing the proportions of cells in each subpopulation. h Volcano plots showing genes that are up or downregulated due to aging in FAPs at a threshold of moderated LFC > 1 and s-value < 0.05. i UMAP plot of scRNA-seq data from young and aged macrophages. j Volcano plots showing genes that are up or downregulated due to aging in macrophages at a threshold of moderated LFC > 1 and s-value < 0.05. k Violin plots of select representative genes that are differentially expressed between young and aged FAPs. l Violin plots of select representative genes that are differentially expressed between young and aged macrophages (moderated LFC > 1, s-value < 0.05).

