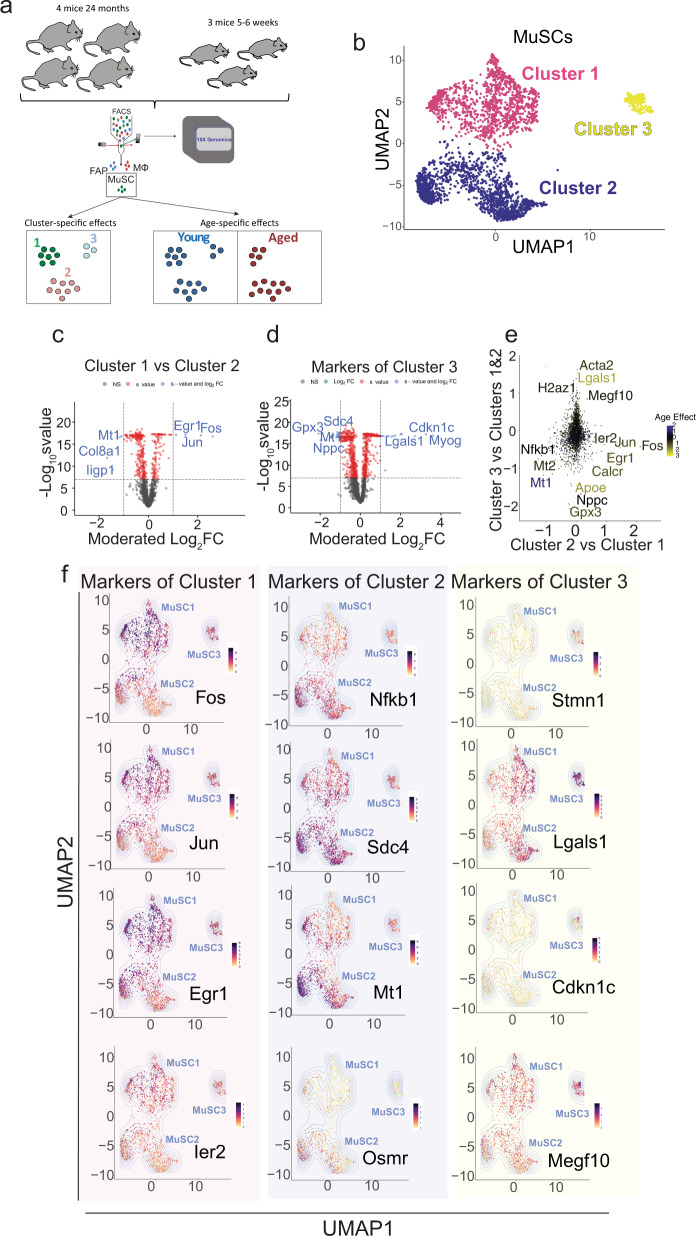
Fig. 2. MuSCs can be classified into three main clusters.
a Schematic diagram of the scRNA-seq analysis on young and aged MuSCs. b UMAP embedding of MuSCs, colored based on cluster. c Volcano plots showing genes that are up or downregulated in Cluster1 compared to Cluster2 of MuSCs, at a threshold of moderated LFC > 1 and s-value < 10−8. d Volcano plots showing genes that are up or downregulated in Cluster 3 compared to Clusters 1 and 2, at a threshold of moderated LFC > 1 and s-value < 10−8. e Scatterplot showing the moderated LFC of differentially expressed genes between Clusters MuSC2 and MuSC1, and between MuSC3 Cluster compared to Clusters MuSC1 & MuSC2. Blue and yellow represent down and upregulated genes respectively during aging. f Gene expression plots in the UMAP embedding for select representative positive marker genes of each cluster ranging from highest (black) to lowest (yellow) expression.

