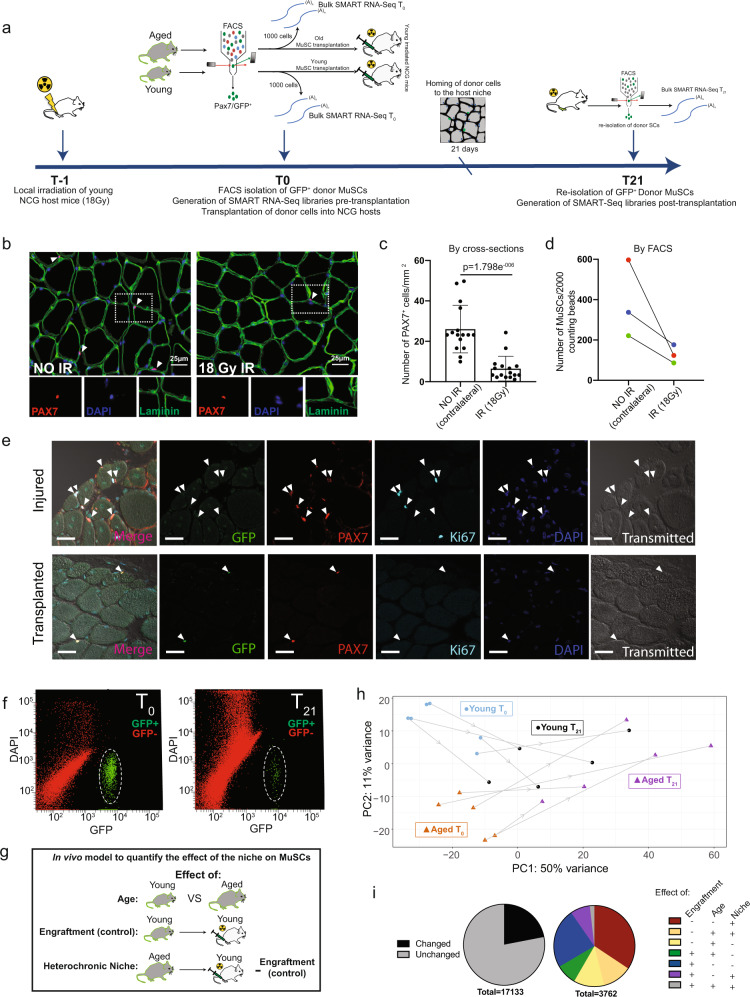
Fig. 4. Development of an allogeneic stem cell transplantation model to directly quantify the effect of the niche environment on the transcriptome of MuSCs.
a Schematic diagram of the pipeline for allogeneic MuSC transplantation. b Immunofluorescent staining for PAX7, Laminin and DAPI on cross-sections from TA muscles that have been treated with 18 Gy of irradiation compared to the contralateral untreated TA muscle (n = 2 mice) c Quantification of the number of Pax7+ MuSCs/mm2 in irradiated compared to untreated contralateral Tibialis Anterior (TA) muscle cross-sections (n = 2 mice, n = 16 cross-sections counted per group, two-tailed t test). Data are presented as mean values SD. p = 1.798e−006. d Quantification of the number of ITGA7+/Lin− MuSCs per 2000 FACS counting beads sorted from irradiated compared to untreated contralateral TA muscles (n = 3 mice) e Immunofluorescent staining for PAX7, GFP, KI67 and DAPI of TA muscles from host mice 21 days post-transplantation with donor cells and cardiotoxin-injured TA muscles, showing engraftment and homing to the niche of GFP+ donor MuSCs, and lack of KI67 in engrafted TAs compared to injured controls. Scale bar = 25 μm (3 independent repeats were performed) f Representative FACS plots showing the isolation of GFP+ MuSCs at T0 (left), followed by the re-isolation of the same cells after engraftment into young NCG mice at T21 (right). g Schematic diagram of the separation of age, engraftment, and niche effects after allogeneic MuSC transplantation. h Principal Component Analysis (PCA) plots of bulk RNA-seq data, from young and aged mice, pre- (T0) and post-transplantation (T21). i Pie chart of the relative proportion of genes that are altered after transplantation into the host niche versus the genes that remain unchanged after transplantation (left). Pie chart of the relative proportions of genes showing an effect of engraftment, age, or the allogeneic niche, in all combinations, from transplantation RNA-seq datasets (right). (Moderated LFC > 1, s-value < 0.05).

