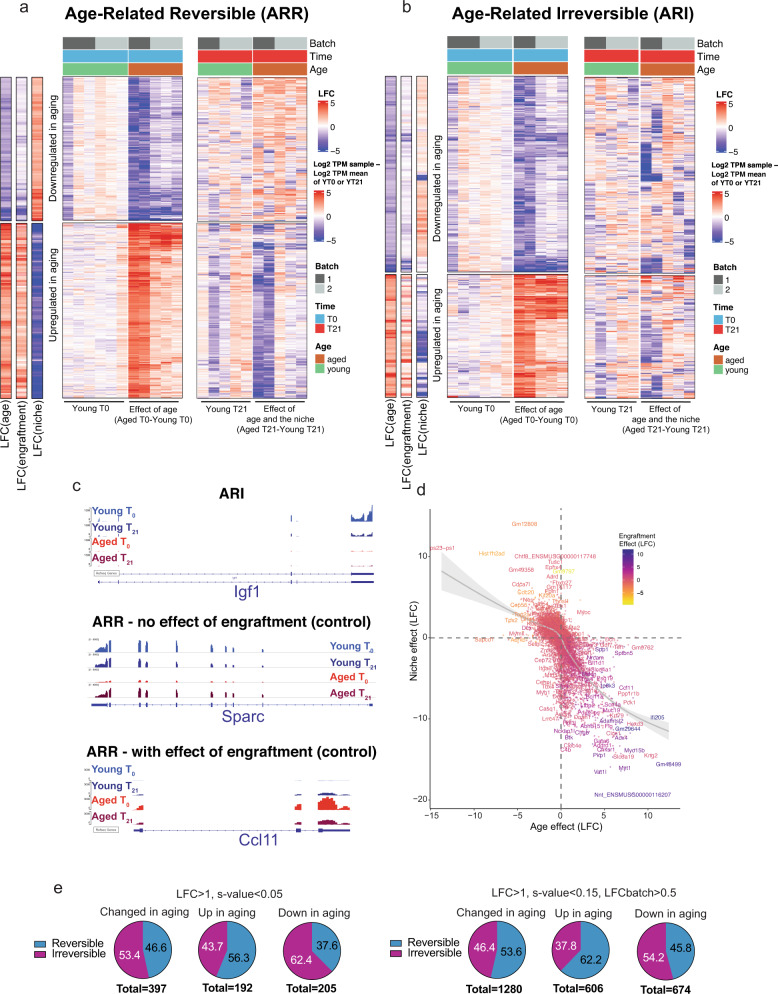
Fig. 5. Exposure to the young niche environment restores a significant portion of the age-related changes in gene expression in MuSCs.
a Heat maps of age-related reversible genes (ARRs) (moderated LFC > 1, s-value < 0.15, LFC batch <0.5). Left columns display the LFCs due to age (Aged T0–Young T0), engraftment (Young T21–Young T0), and the niche (Aged T21–Aged T0–LFC engraftment). The middle column displays the effect of ageing, using the mean of Young T0 samples as baseline. The right column displays the effect of the heterochronic niche, using the mean of Young T21 samples as baseline. b Heat maps of age-related reversible genes (ARRs) (moderated LFC > 1, s-value < 0.15, LFCbatch>0.5). Left columns display the LFCs due to age (Aged T0–Young T0), engraftment (Young T21–Young T0), and the niche (Aged T21–Aged T0–LFC engraftment). The middle column displays the effect of ageing, using the mean of Young T0 samples as baseline. The right column displays the effect of the heterochronic niche, using the mean of Young T21 samples as baseline. c Integrative Genomics Viewer (IGV) tracks for select representative ARIs and ARRs d Scatterplot of the moderated LFCs of the effect of niche exposure vs the effect of age. Gray area represents the 95% confidence interval for the mean. e Pie charts showing the percentage of genes that are up, downregulated, or changed in in either direction in aging that are either reversible or irreversible by exposure to the young niche. Left and right groups of pie charts correspond to different threshold cutoffs for differential gene expression.

