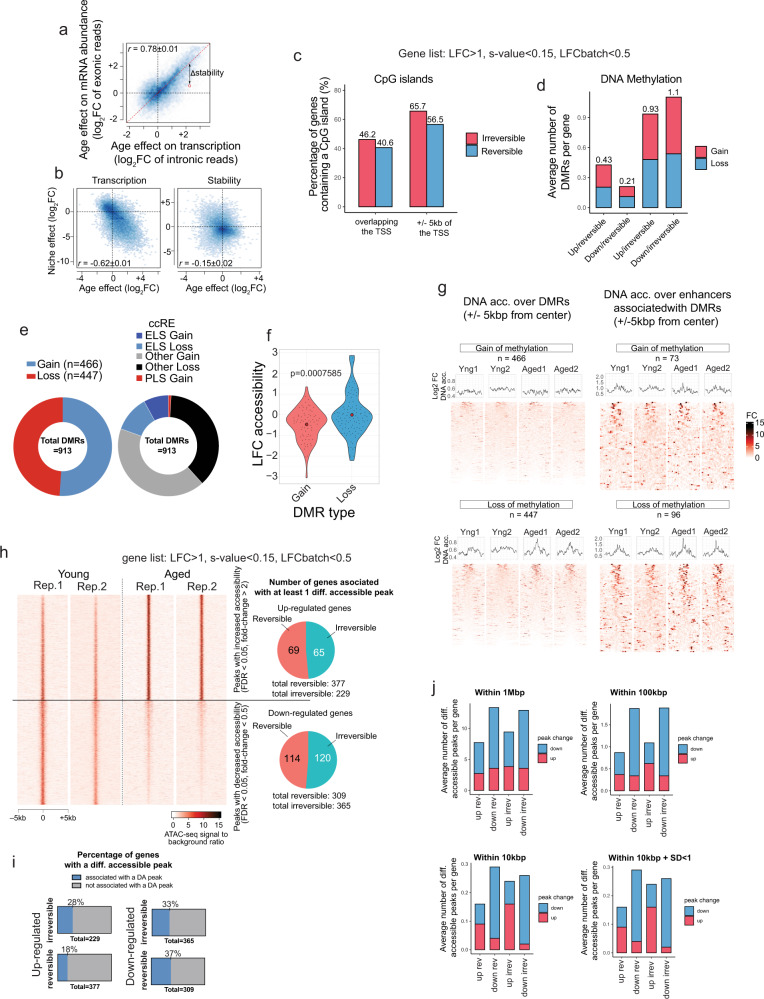
Fig. 6. The epigenetic state dictates the responsiveness to heterochronic niche exposure of genes with altered expression in aging.
a Analysis of RNA stability. Scatterplot showing the age effect on transcription, as measured by changes in intronic read abundance between aged and young cells compared to the age effect of mature RNA abundance, based on exonic reads. Values along the diagonal represent genes that do not show significant difference in RNA stability between MuSCs from young and aged mice. b Scatterplots showing the effect of age compared to the effect of the heterochronic niche on transcription (left) and RNA stability (right). c Quantification of the percentage of reversible and irreversible genes containing a CpG island overlapping with or within 5 kb of their TSS. d Bar plot showing the average number of DMRs per gene for each gene category. e Pie-chart showing the proportion of age-related DMRs corresponding to a gain or loss of methylation (left). Pie Chart showing the proportion of identified age-related DMRs associated with cCREs (±300 bp) that are located within Enhancer-like sequences (ELS), promoter-like sequences (PLS), or other regions of the genome (right). f Violin plots showing the LFC of MuSC chromatin accessibility and age-related DMRs (two-tailed t test). g ATAC-seq pileup analyses showing chromatin accessibility either over DMRs (±2KB) or over enhancers associated with DMRs in young and aged MuSCs. h Left: Heatmap of differentially accessible ATAC-seq peaks, including peaks with increased accessibility in aged cells (up) and those with decreased accessibility (bottom). Right: Pie-charts showing the overlap of differentially accessible peaks with different gene categories. The top pie chart shows the number of reversible/irreversible age-upregulated genes that are associated with at least one age-upregulated peak. The bottom pie chart shows the number of reversible/irreversible age-downregulated genes that are associated with at least one age-downregulated peak. i Bar charts showing the percentage of genes in each category that overlap with differentially accessible peaks. j Bar plots showing the average number of differentially accessible peaks per gene in each category, within 1 Mbp, 100 kb, and 10 kb from the gene TSS (LFC > 1, FDR threshold = 0.05). The bottom right panel involves only genes with the highest reproducibility (standard deviation <1) between samples and batches.

