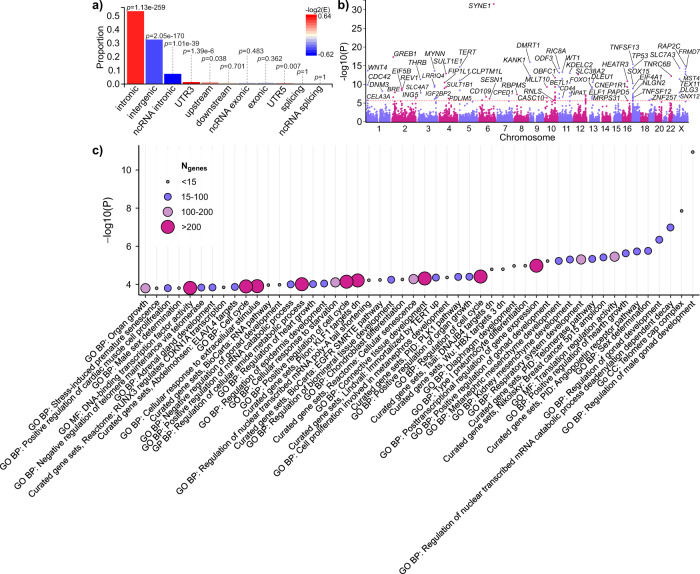
Fig. 3. Variant summary and gene set-based results using genome-wide summary statistics from META-2.
a The proportions of ‘independent genome-wide significant variants’ and ‘variants in LD with independent significant variants’ having corresponding functional annotation. Bars are coloured according to −log2(enrichment) relative to all variants in the reference panel. P values are obtained using Fisher’s exact test (two-sided). b A Manhattan plot of the gene-based test computed by MAGMA51. The input variants were mapped to 19,920 protein-coding genes and, thus, significance was considered at p < 2.51 × 10⁻⁶ (0.05/19,920). Purple and pink colours indicate odd and even chromosome numbers, respectively. Thirty-seven gene symbols are omitted. c MAGMA51 gene-set enrichment analysis was performed for curated gene sets and GO terms available at MsigDB52. The plot shows the results for significantly enriched pathways (pFDR < 0.05). All data plotted in Fig. 3a–c were produced using FUMA49.

