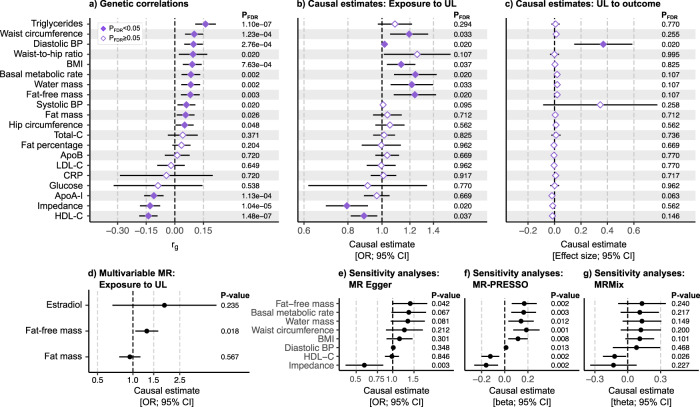
Fig. 5. Genetic correlations and causal relationships between uterine leiomyomata and metabolic and anthropometric traits.
We estimated a genetic correlations (rg) between uterine leiomyomata (UL) and 20 metabolic and anthropometric traits using UL-GWAS data from META-2 (n = 367,903) and summary statistics for other traits as provided by the MRC Integrative Epidemiology Unit (IEU) GWAS database (n ranges from 33,231 to 757,601; the trait-specific sample sizes are provided in Table S11). The analysis software was LDSC21. To dissect the causal relationships, we performed bi-directional two-sample Mendelian randomisation (MR) implemented in the TwoSampleMR R library60,63; the plots (b, c) show the causal estimates obtained using the inverse variance-weighted (IVW) method. We further estimated d the multivariable effects of whole-body fat-free mass, whole-body fat mass, and estradiol level on UL risk using the same TwoSampleMR R library60,63. In sensitivity analyses, we derived causal estimates using e MR Egger (as implemented in TwoSampleMR), f outlier-corrected MR-PRESSO43, and g MRMix44 methods for the traits showing a significant IVW-based causal effect on UL. For all MR analyses, genetic instruments for UL were extracted from the GWAS completed in FinnGen (n = 123,579) and for other, mostly UKBB-based, traits from the MRC IEU GWAS database (n ranges from 33,231 to 757,601; Table S11) except for estradiol, for which the instruments were extracted from a study by ref. 61. (n = 206,927). In all Mendelian randomisation analyses, LD pruning was completed using a European population reference, the threshold of r2 = 0.001, and a clumping window of 10 kb. False discovery rate (FDR)-corrected64 p values <0.05 were considered significant in primary analyses (a–c). Multivariable MR and sensitivity analyses (d–g) were considered exploratory, and no multiple testing correction was applied. The error bars represent the corresponding 95% confidence intervals (CI). Numerical details are provided in Tables S12–S15, and scatter plots and the results of the leave-one-out analyses are shown in Figs. S25, 26 and S28–35, respectively.

