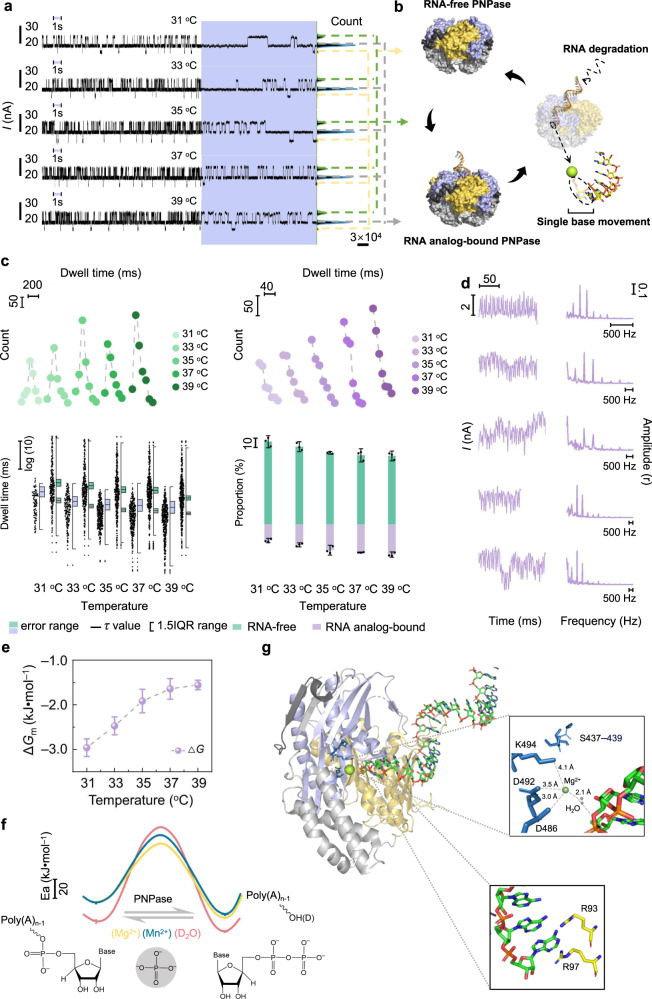
Fig. 3. Dynamic analyses of the degradation process of RNA analog in temperature-dependent experiments.
a Real-time electrical trajectories of the degradation process of poly(A)30. Electrical trajectories marked in blue show a magnified 1-s view of each trace and the corresponding current histograms for each trace are presented on the right. b Schematic diagram of the conversion between RNA-free-PNPase, RNA analog-bound PNPase, and RNA analog degradation states. c Biexponential distributions (upper left) and single-exponential distributions (upper right) of the dwell times corresponding to the RNA analog-bound structure (green) and the degradation structure (purple) (the origin of coordinates: bottom left). Datum point distributions (lower left) of the dwell times from one piece of the data and statistical average dwell time (center) corresponding to each structure (mean of n = 3 technical replicates from three different single-PNPase-modified SiNW devices, error range indicate s.d. 1.5IQR range, 1.5-times the interquartile range.). (Below: the degradation structure; above: the RNA analog-bound structure). Occurrence proportion distributions (lower right) of the degradation structure (purple) and the RNA analog-bound structure (green) (mean of n = 3 technical replicates from three different single-PNPase-modified SiNW devices, error bars indicate s.d.). d Current trajectories of the degradation structure (left panel) and corresponding illustration of low-frequency vibration peaks analyzed by Fourier transform (right panel). e Changes of Gibbs free energy (ΔG) from the RNA analog-bound structure to the degradation structure (mean of n = 3 technical replicates from three different single-PNPase-modified SiNW devices, error bars indicate s.d.). f Activation energy (Ea) distributions for hydrolysis of the phosphodiester bond. Yellow: Mg2+ and H2O; red: Mg2+ and D2O; blue: Mn2+ and H2O. (Mean of n = 3 technical replicates from three different single-PNPase-modified SiNW devices, error bars indicate s.d.). g Schematic diagram of the PNPase RNA analog-binding mode. The magnified image (top panel) shows the complexation of Mg2+ with residues D492, D486, and K494, and the interaction of Mg2+ with the phosphodiester bond, relying on a single H2O. Another magnified image (bottom panel) shows the H-bond interaction of the nucleoside at the 3′-terminus with residues R93 and R97.

