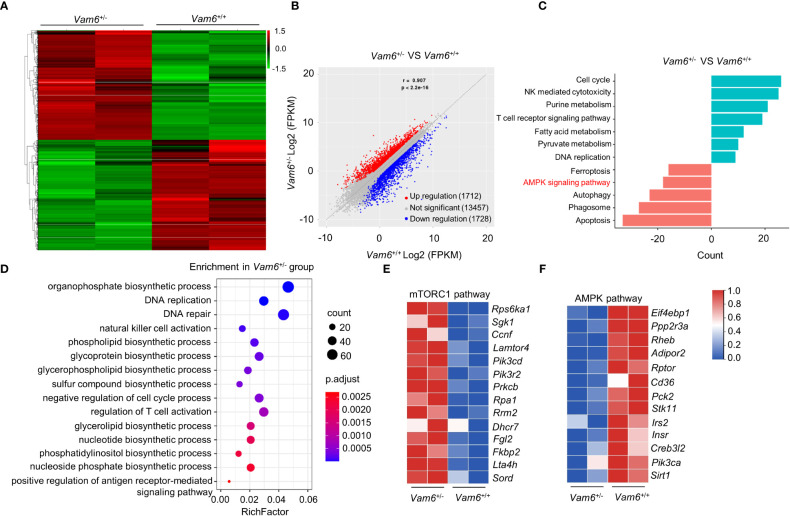
Figure 2.
mRNA-seq data reveal the altered AMPK/mTORC1 signaling in Vam6 +/- iNKT cells. (A) Heatmap displaying 3440 significantly dysregulated genes in Vam6 +/- iNKT cells in comparison with Vam6 +/+ iNKT cells after stimulation with CD1d-PBS57 tetramer for 4 hours. The significance threshold is fold change ≥ 2 and FDR ≤ 0.05. (B) Correlation plot displaying expression of genes in Vam6 +/- iNKT cells and in Vam6 +/+ iNKT cells. (C) KEGG pathway analysis showing pathways downregulated and upregulated in Vam6 +/- iNKT cells. Bars represent the number of differentially expressed genes contributing to each gene set. (D) GO term analysis showing pathways upregulated in Vam6 +/- iNKT cells. (E, F) Heatmaps showing expression of genes involved in mTORC1 pathway (E) and AMPK pathway (F) in Vam6 +/- iNKT cells and in Vam6 +/+ iNKT cells.

