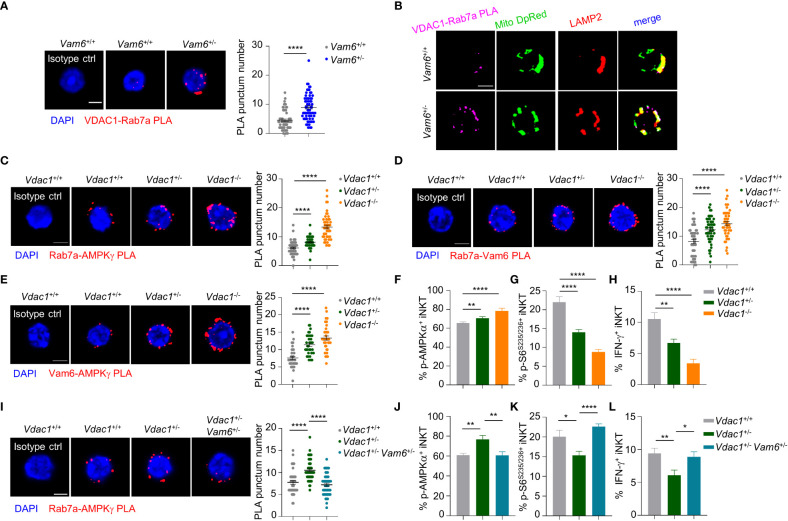
Figure 5.
VDAC1 at mitochondria-lysosome contact site interferes with Vam6- Rab7a-AMPKγ complex formation and AMPK activation. (A) VDAC1-Rab7a PLA puncta in Vam6 +/+ and Vam6 +/- iNKT cells stimulated with anti-CD3 plus anti-CD28 for 4 hours. n = 62-66 cells for each group. Scale bar, 3 μm. (B) Representative confocal images showing colocalization between VDAC1-Rab7a PLA puncta, Mitotracker deep red, and lysosomal LAMP2 in Vam6 +/+ and Vam6 +/- iNKT cells stimulated with CD1d-PBS57 tetramer for 4 hours. Scale bar, 3 μm. (C–E) Rab7a-AMPKγ PLA puncta (C, n = 46-56 cells for each group), Rab7a-Vam6 PLA puncta (D, n = 45-49 cells for each group), and Vam6-AMPKγ PLA puncta (E, n = 33-37 cells for each group) in Vdac1 +/+, Vdac1 +/-, and Vdac1 -/- iNKT cells stimulated with CD1d-PBS57 tetramer for 4 hours. Scale bar, 3 μm. (F–H) Phosphorylation of AMPKα (F), phosphorylation of S6S235/S236 (G), and IFN-γ production (H) in Vdac1 +/+, Vdac1 +/-, and Vdac1 -/- iNKT cells stimulated with CD1d-PBS57 tetramer for 18 hours. n = 12-16 replicates for each group. (I) Rab7a-AMPKγ PLA puncta in Vdac1 +/+, Vdac1 +/-, and Vdac1 +/- Vam6 +/- iNKT cells stimulated with CD1d-PBS57 tetramer for 4 hours. n = 44-51 cells for each group. Scale bar, 3 μm. (J–L) Phosphorylation of AMPKα (J), phosphorylation of S6S235/S236 (K), and IFN-γ production (L) in Vdac1 +/+, Vdac1 +/-, and Vdac1 +/- Vam6 +/- iNKT cells stimulated with CD1d-PBS57 tetramer for 18 hours. n = 12-16 replicates for each group. Data are shown as mean ± SEM (A, C–L) and pooled from two (E), three (A, C, D, G–J), or four (F, K, L) independent experiments. Data were analyzed by two-tailed unpaired Student’s t test (A, C–E, I) and two-tailed Mann-Whitney tests (F–H, J–L). *P < 0.05, **P < 0.01, ****P < 0.0001. See also Supplementary Figures 4–6 .

