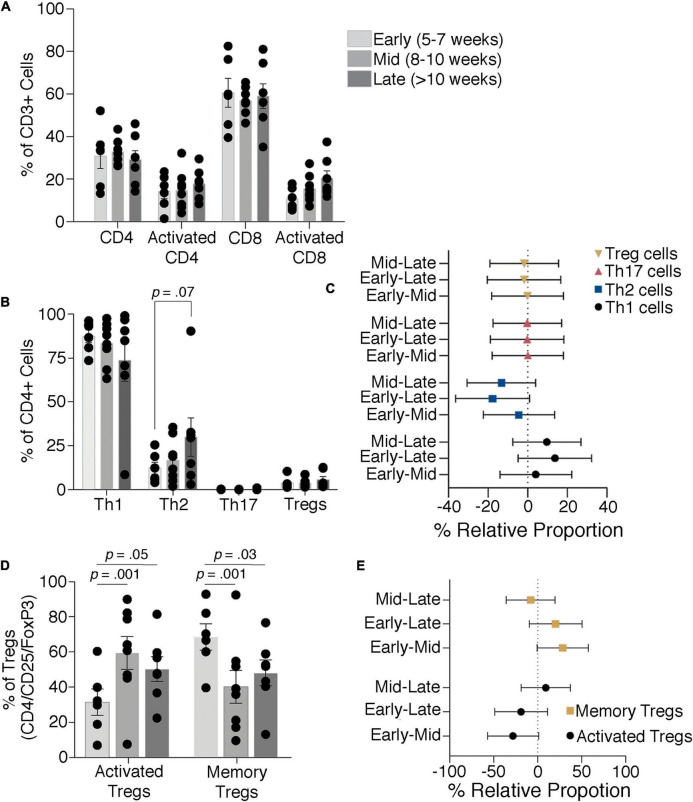
FIGURE 5.
T-cell dynamics through the late first to early second trimester. Proportions of total and activated decidual CD4 and CD8 T-cells (A) and Th1, Th2, Th17, and Treg cells (B,C) show no significant difference through the first trimester, although there is a trend toward an increase in Th2 cells. Activated and memory Tregs levels change with increasing gestational age (D,E). Bars depict group means and error bars represent one standard deviation.

