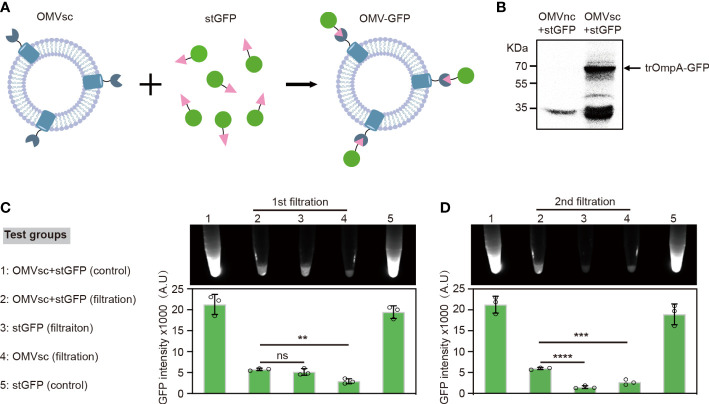
Figure 2.
Click display of GFP on engineered OMVs. (A) A schematic diagram of the click display of GFP on the surface of OMVsc. (B) Detection of the assembly between OMVsc and stGFP by western blot. OMVsc and OMVnc were incubated with stGFP separately and unbond stGFP was washed subsequently. The trOmpA-GFP fusion protein was detected by using an anti-His6 primary antibody. (C) Detection of the fluorescence of OMV-GFP. OMVsc were incubated with stGFP at room temperature to allow in vitro binding. The mixing sample, sfGFP and OMVsc alone were subjected to two rounds of ultrafiltration. Fluorescent images were taken after each around of ultrafiltration and fluorescent intensity was quantitatively analyzed (n=3). An OMVsc and stGFP mixing group and a stGFP group were used as non-ultrafiltration control. The data are shown as mean ± SD. Statistical analysis was performed by one way ANOVA. ns: not significant; **P <0.01; ***P< 0.001; ****P < 0.0001.

