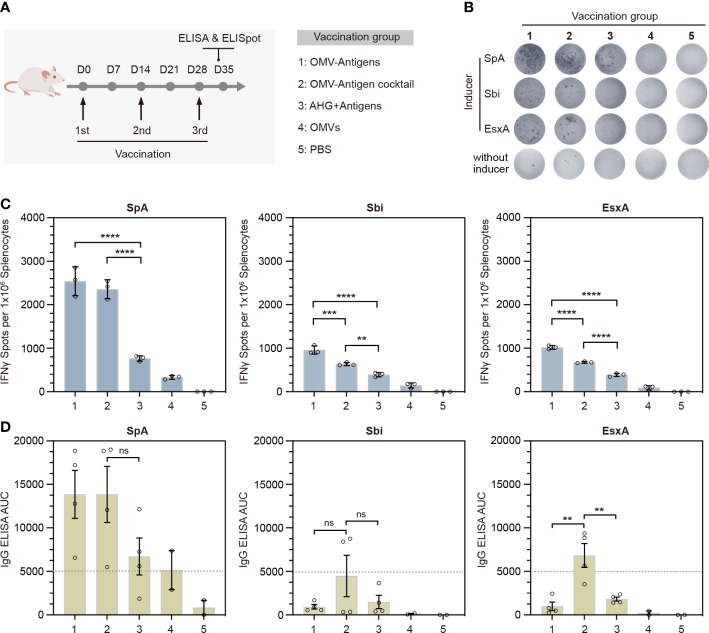
Figure 4.
In vivo immunogenicity test of the OMV-based S. aureus click vaccine. (A) Schematic representation of the vaccination strategy and each vaccination group. (B) Representative images of splenic IFN-γ ELISpot responses for each immunization group. (C) Quantification of IFN-γ positive splenocytes for each immunization group. Splenocytes were prepared from spleens taken from mice (n=3) 7 days post the third immunization. (D) Quantification of antigen-specific IgG for each immunization group by ELISA in terms of the area under the curve (AUC). Sera were taken from mice (n=4) for OMV-Antigens, OMV-Antigen cocktail and AHG+Antigens immunization groups and mice (n=2) from OMV and PBS immunization group 7 days post the third immunization. The data are shown as mean ± SEM. Statistical analysis was performed by one way ANOVA. ns, not significant. **P <0.01; ***P <0.001; ****P <0.0001.

