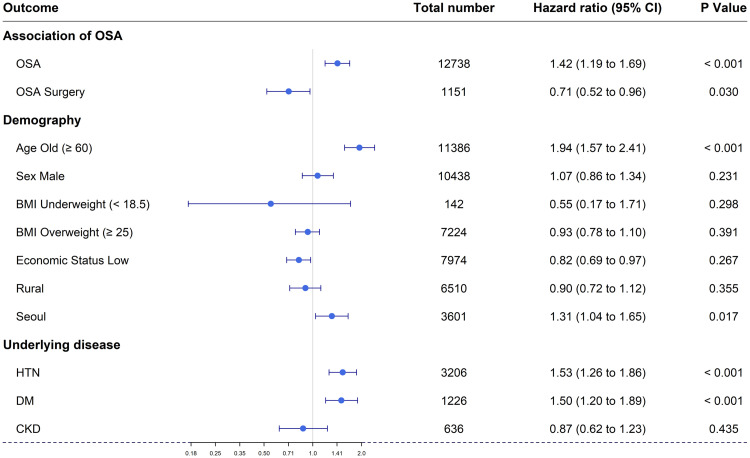
Figure 3. Forest plot of the cumulative hazard ratio for each factor: OSA, OSA surgery, age, sex, economic status, residential area, and underlying disease (HTN, DM, and CKD).
BMI = body mass index, CKD = chronic kidney disease, DM = diabetes mellitus, HTN = hypertension, OSA = obstructive sleep apnea.

