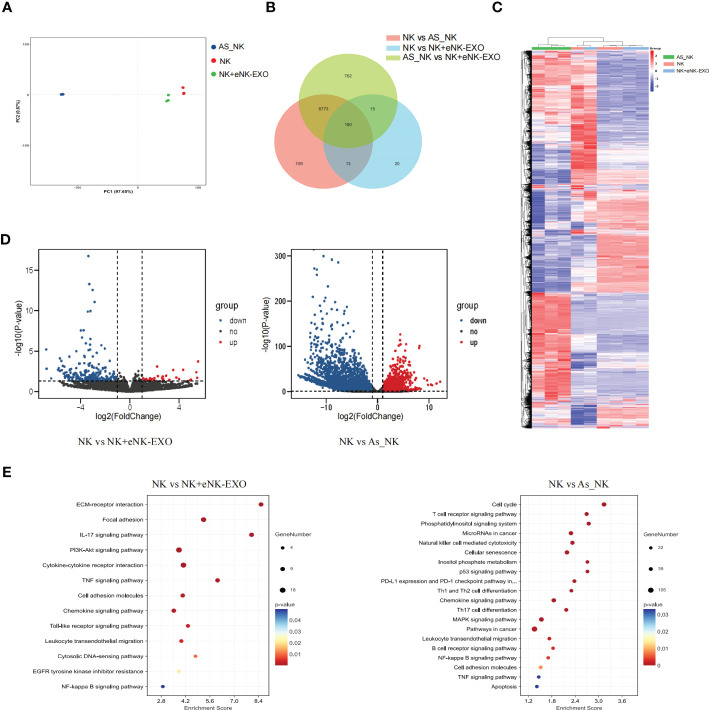
Figure 6.
Global transcriptional analysis of AS_NK and eNK-EXO treated NK cells. (A) Principal component analysis of eNK, AS_NK, and eNK-EXO treated NK cells. (B) Pairwise comparison of all groups. (C) Clustering heatmap of all the DEGs in three groups (color scale represents relative gene transcription level). (D) Volcano plots showing the distribution of significance [-log10(p-value)] and the fold changes in the transcription levels of DEGs [log2(fold change)] within different groups. (E) Bubble chart showing the functional analysis of DEGs when different groups were compared.

