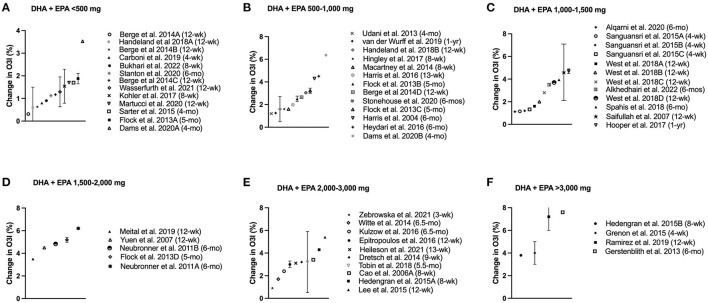
Figure 2.
Change in omega-3 index (O3i) from baseline for protocols using combined EPA + DHA separated by dose. Data are presented as means ± SD (if available in publication). Legend shows length of supplementation/fortification in parentheses. (A) Doses less than 500 mg/d; (B) Doses ranging from 500–1,000 mg/d; (C) Doses ranging from 1,000–1,500 mg/d; (D) Doses ranging from 1,500–2,000 mg/d; (E) Doses ranging from 2,000–3,000 mg/d; (F) Doses exceeding 3,000 mg/d.

