

Summary
Adult-onset cerebellar ataxias are a group of neurodegenerative conditions that challenge both genetic discovery and molecular diagnosis. In this study, we identified an intronic (GAA) repeat expansion in fibroblast growth factor 14 (FGF14). Genetic analysis of 95 Australian individuals with adult-onset ataxia identified four (4.2%) with (GAA)>300 and a further nine individuals with (GAA)>250. PCR and long-read sequence analysis revealed these were pure (GAA) repeats. In comparison, no control subjects had (GAA)>300 and only 2/311 control individuals (0.6%) had a pure (GAA)>250. In a German validation cohort, 9/104 (8.7%) of affected individuals had (GAA)>335 and a further six had (GAA)>250, whereas 10/190 (5.3%) control subjects had (GAA)>250 but none were (GAA)>335. The combined data suggest (GAA)>335 are disease causing and fully penetrant (p = 6.0 × 10⁻⁸, OR = 72 [95% CI = 4.3–1,227]), while (GAA)>250 is likely pathogenic with reduced penetrance. Affected individuals had an adult-onset, slowly progressive cerebellar ataxia with variable features including vestibular impairment, hyper-reflexia, and autonomic dysfunction. A negative correlation between age at onset and repeat length was observed (R2 = 0.44, p = 0.00045, slope = −0.12) and identification of a shared haplotype in a minority of individuals suggests that the expansion can be inherited or generated de novo during meiotic division. This study demonstrates the power of genome sequencing and advanced bioinformatic tools to identify novel repeat expansions via model-free, genome-wide analysis and identifies SCA50/ATX-FGF14 as a frequent cause of adult-onset ataxia.
Keywords: ataxia, repeat expansions, short tandem repeats, whole-genome sequencing, cerebellar ataxia, bilateral vestibulopathy
Graphical abstract
Pathogenic repeat expansions (RE) cause an array of neurogenetic disorders including cerebellar ataxia. While traditionally difficult to identify, new genomic tools and bioinformatic analyses are enabling rapid RE discovery and diagnosis. Here we characterize SCA50, an adult-onset ataxia caused by a pathogenic GAA repeat expansion within intron one of FGF14.
Introduction
Spinocerebellar ataxias (SCAs) are a heterogeneous group of progressive neurological disorders that are estimated to affect 1:33,000 individuals.1 SCAs are caused by pathogenic expansions of short tandem repeats (STRs, also called microsatellites), in addition to deleterious point mutations. STRs are repeated nucleotide motifs of 2–6 base pairs (bp) that are known contributors to genetic polymorphism. There are ∼239,000 STRs documented in the UCSC Genome Browser2 and although current catalogs are incomplete,3 STR loci are unstable and can rapidly mutate to alternative motifs or alter in length. Approximately 50 STRs have been shown to be pathogenic if they expand beyond locus-specific thresholds and result in repeat expansion (RE) disorders.4 These include more common causes of ataxia, such as autosomal-dominant SCA 1, 2, 3, 6, and 7 and autosomal-recessive Friedreich ataxia, as well as rarer forms such as SCA36 and 37. Many people presenting with ataxia receive a clinical diagnosis of idiopathic late-onset cerebellar ataxia (ILOCA)5 or sporadic adult-onset ataxia (SAOA).6 Ataxia may present with other clinical features, including neuropathy, vestibular dysfunction, parkinsonism, cognitive impairment, and psychiatric features, which may provide clues to an underlying genetic diagnosis. However, despite routine clinical testing for the more common causes of ataxia, only ∼10%–30% of individuals with a clinical diagnosis of ataxia receive a genetic diagnosis.7 This is thought to be in part due to as yet unidentified genetic causes, including REs, likely located in noncoding regions of the genome.4
The identification of pathogenic REs has historically been difficult. However, discovery and detection of complex genetic variants, such as REs, in genome-sequencing data have improved due to the advances in bioinformatic tools available to identify both known and novel (i.e., not present in the reference genome) RE.8,9 Using these tools, we recently identified the RE that causes cerebellar ataxia with neuropathy and bilateral vestibular areflexia syndrome (CANVAS [MIM: 614575]), a common cause of adult-onset cerebellar ataxia.10 This RE, a novel (AAGGG)n RE in RFC1 (MIM: 102579), had previously evaded discovery despite presenting a well-defined recessive disease phenotype and a strong linkage region.
In this study we tested the hypothesis that advanced bioinformatic tools and second- and third-generation sequencing technologies provide an opportunity to perform model-free discovery of novel pathogenic REs in cohorts of unrelated individuals with overlapping but heterogeneous disorders. We identified a novel (GAA)n RE within intron 1 of FGF14 (MIM: 601515) that appears to represent the most common genetic cause of adult-onset ataxia described to date.
Material and methods
Cohort recruitment and clinical phenotyping
The Royal Children’s Hospital Human Research Ethics Committee (HREC 28097) and the Walter and Eliza Hall Institute of Medical Research (HREC 18/06) approved the study and all the procedures undertaken were in accordance with the ethical standards of the responsible committees. Individuals with suspected genetic cerebellar ataxia, based on clinical presentation, were recruited from multiple clinicians in Australia. Exclusion criteria were clinical features consistent with an acquired etiology, including onset of ataxia in association with acute injury or illness such as stroke, encephalitis, or sepsis. Informed consent was obtained from all 95 participants and details were collected from clinical assessments and review of medical records. Ancestry information was not collected. All participants were examined clinically by a consultant neurologist, with eight assessed by sub-specialist neuro-otologists. Cerebellar functional assessment included evaluation for gait ataxia, cerebellar dysarthria, and four-limb appendicular ataxia. Oculomotor assessment included documentation (in most) of any abnormal nystagmus, visual pursuit, and saccades to target. Brain MRI scans were assessed visually for regional cerebellar atrophy. Eight individuals underwent nerve conduction studies, but one of these had only lower limb studies. The other seven had motor studies of the median, ulnar, peroneal, and tibial nerves, including F-waves. Six of these seven participants also had upper limb sensory studies including antidromic and orthodromic median, ulnar, and radial digital studies while one person had limited upper limb sensory studies. All eight participants had antidromic sural and superficial peroneal sensory studies. Small nerve fiber studies were performed in six of the eight, with five having QSART testing and six having cutaneous silent period (CSP) studies. The QSART tests a population of C-fibers and the CSP studies test somatic Aδ fibers. Tilt table testing was undertaken in order to assess autonomic nervous system (ANS) function in four of the eight individuals.
The control cohort was composed of 215 unrelated adult individuals recruited from multiple sites in Australia, all healthy at the time of blood sampling (22–66 years of age). Informed consent was obtained, and all procedures were in accordance with the ethical standards of the Royal Children’s Hospital Human Research Ethics Committee, Australia. Ancestry information was not collected but is likely similar to the proband cohort and overall reflect the diversity of backgrounds present in the Australian population. In addition, a panel of 96 lymphoblast-derived gDNA samples from UK control individuals, all healthy at the time of DNA sampling (24–65 years of age), were analyzed (HRC-1 control panel, Sigma Aldrich, #06041301, described by the manufacturer as of “Caucasian” ancestry).
A validation cohort of 104 unrelated individuals with ataxia of an unidentified cause and 190 control individuals from Lübeck, Germany, were included. The ethics committee of the University of Lübeck approved clinical assessments and genetic testing of this cohort (AZ16-039), informed consent was obtained and the procedures followed were in accordance with the ethical standards of this committee. The participants were recruited from the ataxia and vertigo outpatient clinic at the Department of Neurology, University Medical Center Schleswig-Holstein, Campus Lübeck. Vestibulo-oculography, calorimetry, NCS, and MRI were performed in a clinical setup. Some of the clinical MRI scans were not available for a personal review. In this case, information was derived from written reports.
Next generation sequence analysis
Genomic DNA was isolated from peripheral blood and genome sequencing was performed with the TruSeq PCR-free DNA HT Library Preparation Kit and sequenced on the Illumina NovaSeq 6000 platform. Genome-sequence (GS) data generated in-house from 210 unrelated control individuals from the Australian cohort (five samples failed to generate high-quality data) with no clinical evidence of ataxia was used for genetic studies. Targeted long-read sequencing of FGF14 was performed using adaptive sampling on an Oxford Nanopore Technologies MinION Mk1B sequencer. Blood-derived genomic DNA was used to construct sequencing libraries using the manufacturer’s specifications including the NEBNext Companion Module (New England BioLabs) and SQK-LSK110 Ligation Sequencing Kit (Oxford Nanopore Technologies). FLO-MIN106D flow cells (Oxford Nanopore Technologies) were loaded with library and run for 24 h before being washed using the Flow Cell Wash Kit (EXP-WSH004, Oxford Nanopore Technologies) and reloaded with additional library for a further 24 h. Sequencing with adaptive sampling was performed by Readfish (v.0.0.2),11 with the entire gene and a 100 kb flanking region selected for adaptive sequencing enrichment (hg38 chr13:101,610,804–102,502,457).
Alignment and variant calling and STR analysis
For short-read data, alignment was performed based on the GATK best practice pipeline.12,13 Fastq files were aligned to the hg38 reference genome using BWA-mem, then duplicate marking, local realignment, and recalibration was performed with GATK. The RE detection tools exSTRa14 (v.1.1.0) and ExpansionHunter15 (v.5.0.0) were used to screen for known pathogenic REs using default parameters. A database of pre-defined pathogenic REs was used (exSTRa in web resources, file version committed on June 26, 2020). These tools utilize paired-end reads to detect expanded STRs: exSTRa uses an empirical cumulative distribution function (ECDF) to determine outliers, while ExpansionHunter estimates the number of repeats in the STR on each allele. Novel RE discovery was performed for known ataxia-associated genes (candidate gene list curation described below) using ExpansionHunter Denovo9 (EHDN, v.0.9.0) using the outlier method (max-irr-mapq = 60), comparing 47 individuals with ataxia to 210 control subjects with high-quality GS. RE were excluded from further analysis if they were intergenic or only called outliers in only a single ataxia case. EHDN was also used, with default parameters, to profile genome sequence data from the 1000 Genomes Project.16 Analysis was performed on the publicly available 1000 Genomes 30x on GRCh38 data collection.17 Sample metadata, including pedigree information and ethnicity, was obtained from the metadata provided by the 1000 Genomes Project.16
Related individuals were removed from the analysis, leaving 2,483 individuals from diverse ethnic backgrounds. We used nf-cavalier, an in-house Nextflow Pipeline,18 for screening of SNP and indel variants in the Australian cohort (cavalier in web resources). The pipeline utilizes GATK variant calls,19 bcftools,20 IGV,21 and ensembl VEP22 annotations. Variants were filtered according to the following criteria: minimum VEP impact “MODERATE;” maximum cohort allele frequency 0.3; and present on a curated ataxia gene list. Candidate genes were selected from published ataxia gene panels curated by PanelApp Australia and PanelApp UK. Additional genes were obtained from OMIM with a phenotype referencing ataxia. Dominant, recessive, and compound heterozygous inheritance patterns were further filtered using VEP provided gnomAD allele frequencies (AF) as follows: AF dominant ≤ 0.0001, AF recessive ≤ 0.01, AF compound heterozygous ≤ 0.01. IGV screenshots of putative variant calls were then reviewed manually. For the long-read data, base-calling was performed using the Guppy basecaller with a super-accuracy base-calling model (v.6.2.3, Oxford Nanopore Technologies). STR analysis was performed using tandem genotypes23 (v.1.90) after alignment with LAST (v1409). A common ancestral haplotype was determined for three Australian participants with (GAA)>250 by comparing variant sharing around the FGF14 STR for variations with a gnomAD AF < 0.1 using short-read sequencing data.
Molecular genetic studies
We designed a long-range PCR (LR-PCR) assay to test the size of the FGF14 STR utilizing Phusion Flash High-Fidelity PCR Master Mix (ThermoFisher Scientific, F548). The primers (Table S1) flank the STR and are predicted to amplify a 315 bp fragment based on hg38 reference sequence, which includes 50 GAA repeats. PCR was performed in a 20 μL reaction with 50 ng genomic DNA and 0.1 μM of forward and reverse primers. A standard 35 cycle PCR protocol was utilized (98°C denaturation for 1 s, 63°C anneal for 10 s, and 72°C extension for 2 min). Products were visualized using agarose gel electrophoresis and fragment analysis of FAM labeled PCR products was performed on capillary array (ABI3730xl DNA Analyzer, Applied Biosystems) and visualized using PeakScanner 2 (Applied Biosystems). The presence of an expanded FGF14 RE was tested by repeat-primed PCR (RP-PCR) utilizing three primers; FGF14_RPP_ F1_FAM (0.1 μM), FGF14_RPP_AAG_RE_R1 (0.2 μM), and RPP_M13R (0.1 μM, Table S1), with the cycling conditions and analysis described above.
Genetic analysis of the validation cohort
The validation cohort consisted of 104 unrelated individuals with ataxia, 190 control subjects, and two healthy parents of one affected individual. All samples were collected at the University of Lübeck and were predominantly of German ethnicity. LR-PCR was applied to these 296 individuals with the primers listed in Table S1 using a standard PCR protocol with an extension time of 2 min. Products were separated on an automated sequencing machine (Genetic Analyzer 3500XL, Applied Biosystems) using a LIZ1200 size standard. LR-PCR products of samples that appeared to be homozygous (only one allele visible) or carriers of alleles of >900 bp (∼250 repeats) were also separated on an 1% agarose gel to exclude or confirm the presence of expanded alleles. Specificity of the PCR products was confirmed by Sanger sequencing of the repeat-flanking region.
Statistical analyses
Linear regression was performed in R (v.4.0.5) using the base function [lm()] to determine the correlation between age at onset and RE expansion length. A linear equation was determined from the output of the lm function. Fisher exact test was used to test for enrichment of FGF14 RE >(GAA)250 in affected individuals versus control subjects.
Results
Participant recruitment
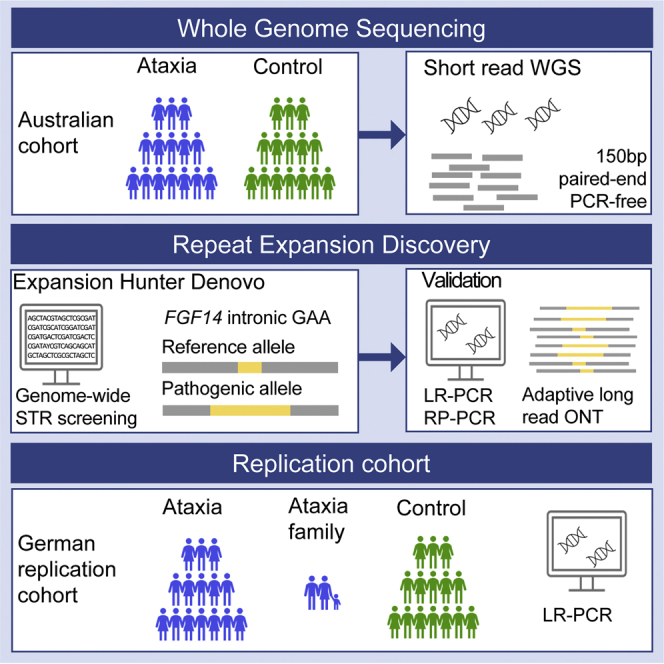
The workflow for this study is summarized in Figure 1. In the first step, 47 adults with ataxia were recruited and underwent short-read genome sequencing, in addition to subsequent LR-PCR and RP-PCR analysis. All were singletons without a verified family history of ataxia. Second, an additional Australian cohort of 48 individuals was recruited and analyzed by LR-PCR and RP-PCR only. All individuals (n = 95) were diagnosed with ataxia based on clinical examination by a neurologist and included 53 female/42 male individuals with adult-onset ataxia (mean age at onset 54 ± 14 years, range 24–72 years). Individuals were excluded if there was clinical suspicion of an acquired cause of ataxia, based on history of acute injury or illness, toxic exposure, or rapid onset. Screening for the pathogenic REs in the genes associated with SCA1, SCA2, SCA3, SCA6, and SCA7 was performed by diagnostic ataxia panel testing prior to research-based genetic testing.
Figure 1.

Overview of the study and investigations performed
Discovery of a novel repeat expansion in FGF14
Given the enrichment of REs as a genetic cause of ataxia, the sequence data of the 47 affected individuals (discovery cohort) was screened for novel REs using ExpansionHunter De novo (EHDN), compared to 210 unrelated control subjects. This analysis identified enrichment of an expanded GAA repeat in intron 1 of FGF14 in participants versus control subjects, with an outlier Z score of 17.48 and was the second candidate on the list. The top candidate was the GAA in FXN, an STR already known to cause Friedreich’s ataxia. Point mutations resulting in haploinsufficiency for FGF14 are a known rare cause of autosomal-dominant spinocerebellar ataxia 27 (SCA27 [MIM: 193003]),24 but REs in this gene have not been previously identified. The (GAA)n STR is located in the hg38 reference genome at chr13:102,161,577–102,161,726 and is reported to consist of 50 pure GAA motifs. Plotting anchored in-repeat reads (a-IRR) from EHDN shows that the STR is present in affected individuals and control subjects, with seven outliers from the affected individuals (a-IRR > 30, Figure 2A) compared to 210 control subjects (Figure 2B). Large a-IRRs are correlated with longer expansion.9 EHDN detected the STR in 21 of 47 affected individuals (44.7%) and 67 of 210 control subjects (31.9%). The individuals in which zero value a-IRR was reported either do not have the FGF14 STR, or it is < 150 bp (50 repeats) in length as this is the minimum size detectable by EHDN (see below). Visualization of the genome sequence reads in IGV confirmed the likely presence of an expanded (GAA)n STR in intron 1 of FGF14 (Figure S1). To further characterize the locus prior to proceeding to molecular validation, genome sequence data was analyzed with exSTRa and ExpansionHunter (Figure S2). Results from exSTRa (Figure S2A) indicate that a (GAA)n STR exists at the locus in a range of sizes in the general population, with many control subjects displaying a high proportion of reads containing full 150 bp-reads of GAA repeats. As a result, outlier analysis using exSTRa is not feasible for this locus. In addition, genotyping with ExpansionHunter identifies (GAA)n REs in the 100 repeat range in both affected individuals and control subjects, although density plots indicate a shift in the distribution toward larger repeats in the affected individuals (Figure S2B).
Figure 2.

RE analysis with EHDN identifies a potentially pathogenic novel intronic GAA RE in FGF14 enriched in the ataxia cohort
(A) Summary of ranked anchored-IRR findings for affected individuals (blue) and control subjects (gray) for the intronic GAA STR in FGF14.
(B) Violin plot showing the difference in distribution of the anchored-IRR for affected individuals (blue) and control subjects (gray) for all individuals with an FGF14 repeat motif of at least (GAA)50. Anchored-IRR for individuals with a repeat less than (GAA)50 are not detected by EHDN; hence, not all individuals analyzed are represented in these plots.
Molecular validation of the FGF14 GAA RE
To confirm expansion of the (GAA)n STR, we performed standard PCR and agarose gel electrophoresis of two affected individuals identified by EHDN and two control subjects predicted to not be expanded. This analysis demonstrated additional products >1,000 bp in the affected individuals, whereas the control subjects only showed products less than 300 bp (Figure 3A). The predicted PCR product size based on hg38 is 315 bp, which includes (GAA)50. We then developed locus-specific LR-PCR and RP-PCR assays to investigate the size and motif composition of the FGF14 STR by capillary array analysis. Consistent with the standard PCR assay, LR-PCR analysis identified a heterozygous expanded allele in both affected individuals, with estimated larger allele sizes of (GAA)289 and (GAA)349, respectively (Figure 3B). In comparison, estimated allele sizes of (GAA)22 and (GAA)12 were observed in the control subjects, matching the standard PCR results. Similarly, we observed an extended saw-toothed “ladder” in affected individuals when the RP-PCR products were analyzed by capillary array, which was absent in control subjects (Figure 3C). These results suggest that EHDN had correctly identified a novel heterozygous (GAA)n RE in intron 1 of FGF14 and validated molecular tools were applied to perform genetic characterization in the larger cohort.
Figure 3.

Molecular validation confirms a heterozygous (GAA) RE in FGF14
(A) Gel electrophoresis of PCR products spanning the FGF14 (GAA) STR locus. Affected individuals (AA2770 and AA2766) produced large PCR products of between ∼1,000 bp and ∼1,200 bp compared to control subjects (ASD1722 and ASD1759 <∼300 bp). No product was observed in the no-template negative control (NTC).
(B) Accurate quantification of (GAA) repeat size was determined by fragment analysis. Individuals with large GAA expansions generated low signal intensity peaks, with staggered peak formations in 3 bp intervals >∼1,000 bp, indicating an allele with a high number of repeats. Electropherograms of non-expanded LR-PCR products displayed a single high intensity spike at <300 bp.
(C) RP-PCR for the (GAA) RE demonstrated an extended saw-toothed product with three base pair repeat unit size in affected individuals that was truncated or absent in control individuals.
We then performed LR-PCR analysis of all 95 affected individuals and 311 control subjects, which included an additional 48 affected individuals with no genome-sequence data. In total, we identified 13 affected individuals with an allele greater than (GAA)250, four of which were (GAA)>335 (Figure 4A, Table S3). Analysis of the available genome data (eight individuals) with EHDN confirmed the presence of large FGF14 (GAA)n expansions. In addition, we screened for pathogenic RE known to cause ataxia using ExpansionHunter and exSTRa, and for pathogenic sequence and copy number mutations in known ataxia-associated genes. No candidate pathogenic variants were identified in these eight individuals. LR-PCR demonstrated only five control subjects had an allele greater than (GAA)250, with the maximum size being (GAA)300. Comparison of allele size estimates by ExpansionHunter and LR-PCR revealed bioinformatic sizing of the RE using short-read GS data was significantly underestimated when the FGF14 RE was greater than ∼(GAA)100 (Figures 4B and 4C). Interestingly, LR-PCR and RP-PCR revealed a consistent symmetrical peak distribution for all 13 affected individuals with an allele greater than (GAA)250 (Figures 3B and 3C), suggestive of a pure (GAA)n RE. This was confirmed by long-read sequencing (Figure S3), with expanded reads in all five samples analyzed with an RE > (GAA)250 being pure GAA. In addition, this analysis also confirmed the RE sizes observed by LR-PCR, with estimates for the two methods differing by less than 5%. In comparison, three of five controls with estimated RE sizes of (GAA)332, (GAA)296, and (GAA)282 displayed unusual LR-PCR peaks (Figure 4D) and RP-PCR traces (Figure 4E). Inspection of the short-read sequence data for these control subjects clearly demonstrated that the RE was not made up of pure GAA motifs, but instead appeared to consist of GAAGGA hexamer repeats (Figure S4). It is well established that interrupted and impure RE can modify disease penetrance and severity in other autosomal-dominant SCA25,26,27 and our analysis raises the possibility that this may apply to disease mediated by GAA expansion in FGF14. Considering only pure expanded (GAA)n STRs, we identified 13 affected individuals (13.7%) with an allele greater than (GAA)250, but only two control subjects (0.6%), with pure repeats of (GAA)272 and (GAA)300, respectively (Figure 4A). Collectively, these data suggest that heterozygous expansion of a pure GAA repeat within intron 1 of FGF14, beyond a threshold of ∼250 motifs, represents a common cause of adult-onset ataxia (Fisher’s exact test p = 2.2 × 10⁻⁷, OR = 24.3 [95% CI = 5.3–224.7]). Pure alleles (GAA)>300 were exclusively found among affected individuals (n = 8) in the Australian cohort.
Figure 4.

Characterization of FGF14 (GAA) RE in study participants
(A) The allele size of the FGF14 (GAA)n STR was determined in all available affected individuals (n = 95) and control subjects (n = 311) using fragment analysis of LR-PCR products. Allele size frequency is indicated on the violin plots, with greater frequency represented by a wider distribution. Thirteen affected individuals demonstrated pure (GAA)>250, compared to only two control subjects.
(B and C) Comparison of FGF14 (GAA) repeat length as determined by LR-PCR and ExpansionHunter for the longer (B) and shorter (C) allele demonstrated ExpansionHunter consistently under-estimates repeat size in comparison to molecular sizing (affected individuals [clear blue] and control subjects [clear gray]). The dotted red line indicates the y = x relationship representing equivalent sizing. Areas of darker blue indicate overlapping points.
(D) Electropherograms from three controls with (GAA)>250 display an unusual pattern, with a single high-intensity peak observed corresponding to the large allele.
(E) RP-PCR analysis demonstrated inconsistent and stunted peak patterns, as opposed to the expected sawtooth “ladder.” This pattern is consistent with an impure/alternate repeat motif.
To test the frequency of the (GAA)n RE in additional populations, we screened a German cohort of 104 individuals with adult-onset ataxia using LR-PCR (Table S2). This analysis identified 15 affected individuals (14.4%) with an allele greater than (GAA)250, compared to 10/190 (5.3%) observed in control subjects (Fisher’s exact test p = 0.014, OR = 3.03 [95% CI = 1.3–7.02]). Given the differences in the frequency of (GAA)>300 in Australian (0/311) and German (7/190) control subjects, we initially analyzed the combined dataset with stringent criteria, requiring the pathogenic cutoff to be greater than the largest observed control allele [(GAA)332]. The results suggest that expanded alleles greater than (GAA)332 are pathogenic and fully penetrant (p = 6.0 × 10⁻⁸, OR = 72 [95% CI = 4.3–1,227]). Similarly, analyzing the combined dataset using the lower size threshold established in the Australian cohort suggests that alleles in the range of (GAA)250-334 are likely to be pathogenic (p = 0.0015, OR = 3.6 [95% CI = 1.6–7.9]), albeit with reduced penetrance.
Large repeats in other SCA are known to be unstable and demonstrate intergenerational variability. For one index participant, DNA samples were also available from clinically unaffected parents, allowing evaluation of germline repeat instability. We observed no change in the size of the paternal (GAA)25 allele, whereas the maternal allele increased from (GAA)282 to (GAA)315 (Figure S5). This observation provides anecdotal evidence of meiotic instability of expanded alleles and incomplete penetrance of (GAA)>250.
Profiling of FGF14-GAA in 1000 genomes project data
Next, we applied EHDN to data from the 1000 Genomes Projects to further characterize the composition of the FGF14 STR locus in diverse populations. EHDN only analyzes reads that contain a pure motif and that are >150 bp, so any STRs that are shorter than the read length (i.e., <150 bp/50 triplet repeats) are not detected by EHDN. We found that the FGF14 STR > (GAA)50 is present in all five super populations represented in the 1000 Genomes project with frequencies of African (8%), admixed American (22.4%), East Asian (8.5%), South Asian (24.1%), and European (32.3%) (Figure S6A). Furthermore, European and South Asian populations have higher a-IRR on average, while African populations have the lowest counts of a-IRR (Figure S6B), indicating that longer forms of the STR are present across populations but in different frequencies. In addition, while (GAA)n is by far the most common, EHDN also identified population-specific alternative motifs that are variations of GAA, including GAAGGA and GAAGAAGAAGAAGCA, both of which are present in East Asian and admixed American populations (Figure S6C).
Analysis of FGF14 expression in primary fibroblast lines
Two predominant mRNA isoforms are produced by FGF14, which result from usage of different first exons. The primary site of expression of the longer isoform (1b) is the brain, with high levels observed in the cerebellum and cortex.28 The (GAA)n RE is located within intron 1 of isoform 1b (Figure S7). Therefore, it is possible that the FGF14 RE can interfere/reduce gene transcription, analogous to how expansion of the only other known (GAA) RE, located in intron 1 of FXN, reduces FXN expression and causes Friedreich ataxia (FRDA [MIM: 229300]).29 Reduced expression of the mutant FGF14 allele could lead to haploinsufficiency, the disease mechanism underlying SCA27, caused by heterozygous mutations in FGF14.24 To test this, we generated primary fibroblasts from three affected individuals with (GAA)244, (GAA)289, and (GAA)348. Expression of both isoforms 1a and 1b is reported to be very low in fibroblast cell lines (GTEx) and indeed we were unable to reliably detect either isoform using TaqMan Gene Expression Assays and standard qRT-PCR or ddPCR, the latter being an extremely sensitive tool for absolute quantitation of gene expression.30 Similarly, Western blot analysis failed to identify FGF14 in protein extracts from participant or control lines, reflecting the low gene expression (data not shown).
Clinical findings
A pure FGF14 RE >(GAA)250 was identified in 13 Australian individuals with cerebellar ataxia (CA). The sex distribution was 5 female to 8 male and mean age at symptom onset was 61 years (range 46–77 years). Participants were evaluated at a mean age of 69 years (range 54–81) after a mean period of 8.5 years (range 1–16) since symptom onset. All displayed a range of clinical ataxic phenomena, with MRI scanning revealing cerebellar atrophy in five of the 13 (Table 1). Six of 10 assessed had evidence of vestibular hypofunction on video head impulse test (vHIT),31 five were bilaterally hypoactive, and one was unilaterally hypoactive. An abnormal video visually enhanced vestibulo-ocular reflex (VVOR) was seen in those with bilateral vestibular hypofunction.32 Where formally assessed with a pure tone audiogram, four of 10 had hearing loss consistent with presbycusis, four of 10 with noise-induced hearing loss (HL), one had unilateral post-traumatic HL and one had early-onset HL (the details of which were unavailable). Additional extracerebellar features are described in Table 1.
Table 1.
Clinical features of individuals with FGF14 GAA expansion
| ID | (GAA)nsize |
Demographics |
Cerebellar clinical features |
Vestibular function |
Neurophysiology |
MRI |
Extracerebellar features | Core phenotype | |||||||||
|---|---|---|---|---|---|---|---|---|---|---|---|---|---|---|---|---|---|
| Sex | Age at onset (y) | Age at assessment (y) | Disease duration (y) | Upper limb ataxia | Lower limb ataxia | Gait ataxia | Oculomotor abnormalities | Truncal ataxia | Cerebellar dysarthria | Hypofunction on vHIT | Sensory +/or motor impairment on NCS | Autonomic nervous system dysfunction | Cerebellar, brain stem, or other atrophy | ||||
| AA2807 | 450 | M | 47 | 57 | 10 | + | + | + | + | + | + | ND | – | ND | – | – | CAa |
| AA2903 | >400 | F | 58 | 68 | 10 | + | + | + | + | – | + | unilateral | – | + | – | hyper-reflexia | CAUV, ANS and hyper-reflexia |
| AA2831 | >400 | M | ND | 66 | ND | – | ND | + | ND | ND | ND | ND | ND | ND | anterior cerebellar atrophy | spasticity | CAb |
| AA2770 | 348 | F | 55 | 71 | 16 | + | + | + | + | – | + | – | – | ND | superior and posterior vermal, mild hemispheric atrophy | chronic cough | CA and cough |
| AA0441 | 317 | M | 65 | 71 | 6 | + | + | + | + | – | + | – | – | ND | – | – | CA |
| AA2895 | 312 | M | 46 | 54 | 8 | – | + | + | + | – | ND | ND | ND | ND | generalized cerebellar atrophy, principally vermis | lower limb hyper-reflexia, spasticity | CAa and spasticity |
| AA2775 | 310 | M | 58 | 68 | 10 | + | + | + | + | – | + | bilateral | – | + | anterior and posterior vermal, mild hemispheric atrophy | lower limb hyper-reflexia | CABV, ANS and hyper-reflexia |
| AA2809 | 309 | M | 70 | 74 | 4 | + | – | + | + | – | – | bilateral | – | +c | – | lower limb hyper-reflexia, parkinsonism | CABV, hyper-reflexia and parkinsonism |
| AA2845 | 298 | F | 69 | 70 | 1 | – | – | + | + | – | – | – | – | ND | – | – | CA |
| AA2766 | 289 | M | 62 | 73 | 11 | + | + | + | + | – | + | bilateral | – | + | superior and posterior vermal, mild hemispheric atrophy | chronic cough | CABV, ANS and cough |
| AA2908 | 281 | F | 59 | 74 | 15 | + | + | + | + | + | + | bilateral | ND | ND | – | clinical ANS dysfunction | CABV and clinical ANS |
| AA2933 | 280 | F | 77 | 81 | 6 | – | – | + | + | – | – | – | ND | ND | – | – | CA |
| AA2926 | 270 | M | 67 | 73 | 6 | + | + | + | + | – | – | bilateral | ND | ND | – | – | CABV |
| L-18362 | ∼460 | M | ND | 71 | ND | + | + | + | + | + | + | bilateral | – | ND | cerebellar atrophy, primarily, superior vermis | spasticity | CABV and spasticity |
| L-17665 | ∼430 | F | 46 | 51 | 5 | – | – | – | + | – | – | bilateral | – | ND | – | – | CABV |
| L-17672 | ∼430 | M | 54 | 56 | 2 | – | + | + | + | – | – | – | – | ND | – | – | CA |
| L-18384 | ∼430 | M | 60 | 64 | 4 | – | – | + | + | – | – | bilateral | – | ND | ND | – | CABV |
| L-20363 | ∼400 | M | 60 | 85 | 25 | + | + | + | + | ND | – | unilateral | – | ND | ND | – | CAUV |
| L-15166 | ∼350 | M | <41 | 46 | >5 | + | + | + | + | ND | + | ND | ND | ND | frontal atrophy | spasticity | CAa, spasticity |
| L-15764 | ∼350 | M | 63 | 70 | 7 | + | + | + | + | + | + | bilateral | – | ND | moderate global atrophy, predominantly cerebellar | – | CABV |
| L-14630 | ∼340 | M | 54 | 75 | 21 | – | – | + | + | – | – | ND | ND | ND | – | clinical ANS dysfunction | CAa and clinical ANS |
| L-10410 | ∼320 | F | ND | ND | ND | ND | ND | + | ND | ND | ND | ND | ND | ND | ND | ND | CA |
| L-15891 | ∼310 | M | 70 | 75 | 5 | + | + | + | – | ND | – | bilateral | ND | ND | – | clinical ANS dysfunction | CABV and clinical ANS |
| L-15754 | ∼290 | F | 74 | 84 | 10 | + | + | + | + | ND | – | bilateral | ND | ND | – | clinical ANS dysfunction | CABV and clinical ANS |
| L-14575 | ∼290 | M | 60 | 81 | 21 | + | ND | + | + | ND | + | bilateral | ND | ND | ND | sensory neuropathy | CABV, neuropathy |
| L-15713 | ∼270 | M | 74 | 76 | 2 | + | + | + | + | + | + | bilateral | – | ND | global brain and cerebellar atrophy | clinical ANS dysfunction | CABV and clinical ANS |
| L-15739 | ∼270 | F | 75 | 77 | 2 | – | – | + | + | ND | – | bilateral | – | ND | global brain atrophy | – | CABV |
| L-15629 | ∼270 | M | 76 | 83 | 7 | + | + | + | + | + | – | – | ND | ND | global brain and cerebellar atrophy | – | CA |
vhit, video head impulse test; NCS, nerve conduction study; ANS, autonomic nervous system; M, male; F, female; +, present; −, absent; ND, no data available; CA, cerebellar ataxia; CABV, cerebellar ataxia and bilateral vestibulopathy; CAUV, cerebellar ataxia and unilateral vestibulopathy.
vHIT not performed.
cerebellar ataxia no other phenotypic information available.
present on anti-hypertensive medication.
Neurophysiology
Both motor and sensory studies were normal in the six affected individuals in whom a detailed nerve conduction study was performed (Table 1), apart from two who had focal median motor and sensory slowing across the wrists, indicating asymptomatic median neuropathies at the wrists (i.e., asymptomatic carpal tunnel syndrome). The findings were normal in the individual who had only lower limb studies. The findings in the one individual who had lower limb studies and limited upper limb studies were normal apart from an asymptomatic median neuropathy at the wrist. Small nerve fiber studies were normal in the six affected individuals in whom they were performed and provided no evidence of a somatic small fiber neuropathy. All four individuals who underwent tilt table testing had borderline to mild asymptomatic orthostatic falls of the systolic blood pressure of 18–37 mmHg. One of these individuals who also had a reduced heart rate response to deep breathing and standing was taking anti-hypertensive medication at the time of testing and, given this potential confound, we can only conclude that three displayed evidence of orthostatic hypotension. In addition, one participant had a reduced heart rate response to deep breathing and standing. Overall, the neurophysiology investigations failed to show consistent evidence of somatic large or small fiber neuropathy or neuronopathy. The tilt table and autonomic testing suggests likely involvement of the autonomic nervous system.
Age at onset analysis
RE length is often inversely correlated with disease age at onset. We applied a linear regression model to determine the relationship between FGF14 RE length and ataxia onset age for the individual cohorts and also for the pooled data (Figure S8A). This analysis identified an inverse correlation (R2 = 0.44, p = 0.00045, slope = −0.12). The regression suggests that for every (GAA)10 increase above 250 repeats, the age of onset is reduced by ∼1.16 years. Similar results were observed when the Australian (R2 = 0.36, p = 0.038, slope = −0.10) and German (R2 = 0.55, p = 0.0058, slope = −0.14) cohorts were analyzed independently (Figures S8B and S8C).
Discussion
Cerebellar ataxia (CA) may be defined as a disturbance of the normal co-ordination of movements and comes about when there is an impairment of cerebellar function. CA have multiple etiologies and many are associated with progressive and debilitating illness. Pathogenic repeat expansions collectively represent the most common genetic cause of CA and while they have traditionally proven difficult to both discover and assess diagnostically using standard molecular tools and practices, recent advances in genomic technologies have begun to address these limitations.33,34 Here we demonstrate the power of new bioinformatic tools and second and third generation sequencing platforms by identifying and characterizing a novel pathogenic (GAA)n RE within intron 1 of FGF14 in a significant proportion of unresolved individuals with adult-onset ataxia. We replicate the initial finding made in an Australian cohort in an independent German cohort. Interestingly, seven (GAA)301-332 alleles were observed in German control subjects, compared to none in the Australian samples. This may reflect a difference in population structure or the fact that some of these may represent non-pure alleles, which were identified and removed from the Australian dataset. Irrespective, our data strongly support a fully penetrant threshold of (GAA)>335 for this RE and also supports (GAA)>250 as likely pathogenic, albeit with reduced penetrance. However, defining the pathogenic range will require additional, larger studies in aged control subjects since the disease onset can occur very late in life; onset ages of 70 and 77 years were observed in our cohorts. Given that de-identified DNA samples for “healthy” control subjects, such as the HRC1 panel used in this study, are often acquired many years prior to potential disease onset, it is difficult to determine if an expanded allele is non-penetrant, below a “pathogenic” threshold, or simply that the individual is yet to manifest the condition. In addition, this study has highlighted the likely need to determine both the size and structure (repeat sequence) of expanded FGF14 alleles as a part of molecular diagnosis. Achieving a genetic diagnosis confers a number of benefits including definitive diagnosis, improved prognostication, possible implications for reproductive choices, and identification of gene therapy targets. We anticipate increasing application of third generation (long-read) sequencing technologies in diagnostic facilities to meet the challenges of accurate genetic diagnosis for FGF14 and indeed the majority of RE-mediated disorders. We demonstrate that FGF14 can be efficiently targeted and screened with the adaptive sampling technique afforded by ONT sequencing.
While this study has a cross-sectional cohort design, our results suggest that FGF14 RE-mediated disease can result from either de novo expansion or familial inheritance of an expanded pathogenic allele. Three individuals share a core haplotype spanning ∼395 kbp, suggesting distant relatedness and inheritance of a founder RE. Indeed, the haplotype includes rs72665334, a single-nucleotide variant identified by GWASs as associated with down beat nystagmus (DBN).35 Given that DBN is the most common form of abnormal central nervous system-mediated nystagmus36 and is observed in a broad range of CAs, it is not surprising that it is a feature of FGF14 RE-mediated disease. However, the haplotype result raises the intriguing possibility that DBN-associated rs72665334, present in the global population with an aggregate allele frequency of ∼5% (dbSNP-ALFA), is actually the result of the variant being on a founder haplotype in linkage disequilibrium with a FGF14 (GAA)n RE. Although this study does not include FGF14-linked multiplex families to determine intergenerational RE stability, our analysis of control cohorts and the 1000 Genomes Project (Figures 4 and S6) has demonstrated that the FGF14 (GAA)n STR is highly polymorphic in the population. Moreover, we observed intergenerational expansion of a (GAA)282 allele in an unaffected female to (GAA)315 in her affected daughter (Figure S5).
Members of the FGF family possess broad mitogenic and cell survival activities and are involved in a variety of biological processes, including embryonic development, morphogenesis, tissue repair, tumor growth, and invasion. FGF14, and in particular isoform 1b, is widely expressed in the developing and adult brain, with highest levels observed in the cerebellum and cerebral cortex.28 The protein binds to voltage-gated Na+ (NaV) channels and promotes their localization to the proximal region of the axon, providing the fine-tuned regulation necessary for normal functioning.37,38 The development of ataxia and paroxysmal dyskinesia in mice lacking Fgf14 was the first direct evidence potentially linking the gene to human disease.39 Notably, FGF14 is required for spontaneous and evoked firing in cerebellar Purkinje neurons and for motor co-ordination and balance.40,41 Therefore, although our functional studies of primary fibroblasts were inconclusive, we hypothesize that the pathogenic mechanism underlying FGF14 (GAA)n-mediated ataxia is reduced functional protein due to decreased expression of the allele with the RE. Such a mechanism is somewhat analogous to Friedreich ataxia, the only other known example of an ataxia mediated by a (GAA)n RE. This mechanism is also consistent with our observation that GAAGGA repeats, such as (GAAGGA)166, equivalent in size to (GAA)332, are not associated with ataxia (Figure 3). GGA interruptions in long GAA repeats have been shown to inhibit the formation of triplex and sticky DNA structures and alleviate transcription inhibition.42 However, additional functional studies will be required to test the haploinsufficiency hypothesis. This could be achieved by direct analysis of FGF14 mRNA expression and/or steady-state protein level in postmortem brain from individuals with a pathogenic expanded repeat. Alternatively, generating and analyzing neurons differentiated from proband-derived iPSCs would likely be informative regarding the effect of the GAA expansion on FGF14 expression.
Our proposed genotype-phenotype correlation is consistent with the observation that point mutations and other non-RE genetic variants in FGF14 cause autosomal-dominant cerebellar ataxia (SCA27, also known as ATX-FGF14).24,43 The underlying pathogenic mechanism in SCA27 is a 50% reduction in the normal level of functional protein, i.e., haploinsufficiency. SCA27 is a rare form of inherited CA and is described in fewer than 30 families.44 Affected individuals tend to present with early-onset CA associated with widespread tremors, dyskinesias, significant cognitive impairment, and psychiatric features,24,45,46 the latter potentially severe.47 Less commonly reported signs are microcephaly, clinodactyly, and pes cavus.43 In contrast, people with FGF14 (GAA)n-mediated ataxia present at a later age with a less severe disease course, outcomes predicted by a reduction but not complete loss of expression of the mutant FGF14 allele. A similar genotype-phenotype correlation occurs with CACNA1A: heterozygous point mutations are associated with episodic ataxia (EA2 [MIM: 108500]), which almost exclusively manifests prior to 20 years of age whereas a (CAG)n RE in the gene is associated with an adult-onset, slowly progressive spinocerebellar ataxia (SCA6 [MIM: 183086]).48
The core phenotypes associated with FGF14 (GAA)n-mediated ataxia are pure CA and cerebellar ataxia with bilateral vestibulopathy (CABV), with the variable presence of other features including hyper-reflexia and autonomic dysfunction. Notably, both CA and CABV are conspicuously under-represented in individuals with ataxia in whom a genetic diagnosis is achieved. For example, they are rarely observed in RFC1-mediated disease,49,50 which is thought to be the most common inherited cause of CA.51 The identification and high prevalence of FGF14 (GAA)n-mediated ataxia, a novel RE mutation mechanism in a gene previously known to cause a related phenotype, may account for a significant proportion of unresolved individuals with ataxia and fill this diagnostic vacuum. A noteworthy feature of our study is that several participants partially fulfilled criteria for CANVAS with cerebellar ataxia and vestibulopathy, some with additional cough and autonomic failure but all lacking large fiber sensory neuropathy. Our identification of a FGF14 (GAA)n RE in these patients provides an alternative genetic cause in individuals with CANVAS-like syndromes negative for bi-allelic RFC1 RE. A feature of other RE-mediated CAs such as SCA1,2,3,6,752 and Friedreich ataxia53 is an inverse relationship between repeat length and age at disease onset. Identifying such a relationship can aid prognostication; for example, in Machado-Joseph disease (SCA3 [MIM: 607047]), larger expansions are also associated with a more rapid disease progression and varying phenotypes.6 Despite the relatively small cohort sizes, we identified a negative correlation between age at onset and repeat length (R2 = 0.44, p = 0.00045, slope = −0.12, Figure S8).
In conclusion, we show that a heterozygous (GAA)n RE located in intron 1 of FGF14 is a common cause of adult-onset ataxia, in particular individuals with pure CA or CABV phenotypes, a cohort in whom genetic diagnosis is relatively rarely forthcoming. Consistent with the nomenclature guidelines widely utilized by clinicians, we propose the name SCA50 for this newly described disorder. In accordance with the guidelines established by the Movement Disorder Society Task Force for genetic movement disorders54,55 the nomenclature for this ataxia is ATX-FGF14. Our data suggest that (GAA)>250 be considered as pathogenic, with acknowledgment of potential incomplete penetrance. It is not currently possible to define an upper size whereby expansions might be classified as fully penetrant, but our analysis of >500 control subjects suggests (GAA)>335. Generating more specific pathogenic ranges will require analysis of large cohorts and families. In addition, given that both size and composition appear to be key mediators of pathogenicity, fully resolving these key questions will require application of advanced sequencing technologies, in addition to more traditional molecular tools such as LR-PCR and RP-PCR. Notably, despite the advances in RE diagnostics being enabled by short-read genome sequencing,56 this study highlights limitations of short-read data and bioinformatic tools such as ExpansionHunter and exSTRa to interrogate the structure of the (GAA)n RE and the difficulty in interrogating larger REs (>150 bp). Application of multiple bioinformatic tools, including EHDN, in combination with long-read sequencing technologies will be required to unravel the full genotype-phenotype relationships in SCA50.
Acknowledgments
This work was supported by the Australian Government National Health and Medical Research Council grants (GNT2001513 and MRFF2007677) to P.J.L., M.B.D., and H.R. H.R. was supported by an NHMRC Emerging Leadership 1 grant (1194364) and M.B. was supported by an NHMRC Leadership 1 grant (1195236). Additional funding was provided by the Independent Research Institute Infrastructure Support Scheme, the Victorian State Government Operational Infrastructure Program and the Murdoch Children's Research Institute. N.B. and K.L. are supported by research grants from the Deutsche Forschungsgemeinschaft (DFG, FOR 2488). We would like to thank Frauke Hinrichs for technical support and Christoph Helmchen, Max Borsche, and Meike Kasten for help with the recruitment of the German participants.
Declaration of interests
The authors declare no competing interests.
Published: December 8, 2022
Footnotes
Supplemental information can be found online at https://doi.org/10.1016/j.ajhg.2022.11.015.
Contributor Information
Melanie Bahlo, Email: bahlo@wehi.edu.au.
Paul J. Lockhart, Email: paul.lockhart@mcri.edu.au.
Web resources
Cavalier, https://github.com/bahlolab/nf-cavalier
curated ataxia gene list, https://doi.org/10.5281/zenodo.7317517
dbSNP-ALFA, https://www.ncbi.nlm.nih.gov/snp/docs/gsr/alfa/
Genotype-Tissue Expression (GTEx) project, https://gtexportal.org/home/
Genome Aggregation Database (gnomAD), http://gnomad.broadinstitute.org/
Integrative Genomics Viewer (IGV), http://software.broadinstitute.org/software/igv/
Online Mendelian Inheritance in Man, http://www.omim.org/
PanelApp Australia, https://panelapp.agha.umccr.org/
PanelApp UK, https://panelapp.genomicsengland.co.uk/
UCSC Genome Bioinformatics database, https://genome.ucsc.edu/
Varsome, https://varsome.com
Supplemental information
Data and code availability
The accession for the FGF14 variants reported in this paper is ClinVar: SCV002576522. The datasets and code supporting the current study are available at the links described in web resources. Sequencing data have not been deposited in a public repository due to restrictions associated with participant consent but are available from the corresponding author on reasonable and appropriate request.
References
- 1.Ruano L., Melo C., Silva M.C., Coutinho P. The global epidemiology of hereditary ataxia and spastic paraplegia: a systematic review of prevalence studies. Neuroepidemiology. 2014;42:174–183. doi: 10.1159/000358801. [DOI] [PubMed] [Google Scholar]
- 2.Benson G. Tandem repeats finder: a program to analyze DNA sequences. Nucleic Acids Res. 1999;27:573–580. doi: 10.1093/nar/27.2.573. [DOI] [PMC free article] [PubMed] [Google Scholar]
- 3.Mousavi N., Shleizer-Burko S., Yanicky R., Gymrek M. Profiling the genome-wide landscape of tandem repeat expansions. Nucleic Acids Res. 2019;47:e90. doi: 10.1093/nar/gkz501. [DOI] [PMC free article] [PubMed] [Google Scholar]
- 4.Depienne C., Mandel J.L. 30 years of repeat expansion disorders: what have we learned and what are the remaining challenges? Am. J. Hum. Genet. 2021;108:764–785. doi: 10.1016/j.ajhg.2021.03.011. [DOI] [PMC free article] [PubMed] [Google Scholar]
- 5.Harding A.E. Idiopathic" late onset cerebellar ataxia. A clinical and genetic study of 36 cases. J. Neurol. Sci. 1981;51:259–271. doi: 10.1016/0022-510x(81)90104-0. [DOI] [PubMed] [Google Scholar]
- 6.Klockgether T., Kramer B., Lüdtke R., Schöls L., Laccone F. Repeat length and disease progression in spinocerebellar ataxia type 3. Lancet. 1996;348:830. doi: 10.1016/S0140-6736(05)65255-5. [DOI] [PubMed] [Google Scholar]
- 7.Rexach J., Lee H., Martinez-Agosto J.A., Németh A.H., Fogel B.L. Clinical application of next-generation sequencing to the practice of neurology. Lancet Neurol. 2019;18:492–503. doi: 10.1016/S1474-4422(19)30033-X. [DOI] [PMC free article] [PubMed] [Google Scholar]
- 8.Bahlo M., Bennett M.F., Degorski P., Tankard R.M., Delatycki M.B., Lockhart P.J. Recent advances in the detection of repeat expansions with short-read next-generation sequencing. F1000Res. 2018;7:736. doi: 10.12688/f1000research.13980.1. [DOI] [PMC free article] [PubMed] [Google Scholar]
- 9.Dolzhenko E., Bennett M.F., Richmond P.A., Trost B., Chen S., van Vugt J.J.F.A., Nguyen C., Narzisi G., Gainullin V.G., Gross A.M., et al. ExpansionHunter Denovo: a computational method for locating known and novel repeat expansions in short-read sequencing data. Genome Biol. 2020;21:102. doi: 10.1186/s13059-020-02017-z. [DOI] [PMC free article] [PubMed] [Google Scholar]
- 10.Rafehi H., Szmulewicz D.J., Bennett M.F., Sobreira N.L.M., Pope K., Smith K.R., Gillies G., Diakumis P., Dolzhenko E., Eberle M.A., et al. Bioinformatics-based identification of expanded repeats: a non-reference intronic pentamer expansion in RFC1 causes CANVAS. Am. J. Hum. Genet. 2019;105:151–165. doi: 10.1016/j.ajhg.2019.05.016. [DOI] [PMC free article] [PubMed] [Google Scholar]
- 11.Payne A., Holmes N., Clarke T., Munro R., Debebe B.J., Loose M. Readfish enables targeted nanopore sequencing of gigabase-sized genomes. Nat. Biotechnol. 2021;39:442–450. doi: 10.1038/s41587-020-00746-x. [DOI] [PMC free article] [PubMed] [Google Scholar]
- 12.DePristo M.A., Banks E., Poplin R., Garimella K.V., Maguire J.R., Hartl C., Philippakis A.A., del Angel G., Rivas M.A., Hanna M., et al. A framework for variation discovery and genotyping using next-generation DNA sequencing data. Nat. Genet. 2011;43:491–498. doi: 10.1038/ng.806. [DOI] [PMC free article] [PubMed] [Google Scholar]
- 13.Auwera G.A., Carneiro M.O., Hartl C., Poplin R., Del Angel G., Levy-Moonshine A., Jordan T., Shakir K., Roazen D., Thibault J., et al. From FastQ data to high confidence variant calls: the Genome Analysis Toolkit best practices pipeline. Curr. Protoc. Bioinformatics. 2013;43 doi: 10.1002/0471250953.bi1110s43. 11 10 11-11 10 33. [DOI] [PMC free article] [PubMed] [Google Scholar]
- 14.Tankard R.M., Bennett M.F., Degorski P., Delatycki M.B., Lockhart P.J., Bahlo M. Detecting expansions of tandem repeats in cohorts sequenced with short-read sequencing data. Am. J. Hum. Genet. 2018;103:858–873. doi: 10.1016/j.ajhg.2018.10.015. [DOI] [PMC free article] [PubMed] [Google Scholar]
- 15.Dolzhenko E., Deshpande V., Schlesinger F., Krusche P., Petrovski R., Chen S., Emig-Agius D., Gross A., Narzisi G., Bowman B., et al. ExpansionHunter: a sequence-graph-based tool to analyze variation in short tandem repeat regions. Bioinformatics. 2019;35:4754–4756. doi: 10.1093/bioinformatics/btz431. [DOI] [PMC free article] [PubMed] [Google Scholar]
- 16.1000 Genomes Project Consortium. Auton A., Brooks L.D., Durbin R.M., Garrison E.P., Kang H.M., Korbel J.O., Marchini J.L., McCarthy S., McVean G.A., Abecasis G.R. A global reference for human genetic variation. Nature. 2015;526:68–74. doi: 10.1038/nature15393. [DOI] [PMC free article] [PubMed] [Google Scholar]
- 17.Byrska-Bishop M., Evani U.S., Zhao X., Basile A.O., Abel H.J., Regier A.A., Corvelo A., Clarke W.E., Musunuri R., Nagulapalli K., et al. High-coverage whole-genome sequencing of the expanded 1000 Genomes Project cohort including 602 trios. Cell. 2022;185:3426–3440.e19. doi: 10.1016/j.cell.2022.08.004. [DOI] [PMC free article] [PubMed] [Google Scholar]
- 18.Di Tommaso P., Chatzou M., Floden E.W., Barja P.P., Palumbo E., Notredame C. Nextflow enables reproducible computational workflows. Nat. Biotechnol. 2017;35:316–319. doi: 10.1038/nbt.3820. [DOI] [PubMed] [Google Scholar]
- 19.McKenna A., Hanna M., Banks E., Sivachenko A., Cibulskis K., Kernytsky A., Garimella K., Altshuler D., Gabriel S., Daly M., DePristo M.A. The Genome Analysis Toolkit: a MapReduce framework for analyzing next-generation DNA sequencing data. Genome Res. 2010;20:1297–1303. doi: 10.1101/gr.107524.110. [DOI] [PMC free article] [PubMed] [Google Scholar]
- 20.Li H. A statistical framework for SNP calling, mutation discovery, association mapping and population genetical parameter estimation from sequencing data. Bioinformatics. 2011;27:2987–2993. doi: 10.1093/bioinformatics/btr509. [DOI] [PMC free article] [PubMed] [Google Scholar]
- 21.Robinson J.T., Thorvaldsdóttir H., Winckler W., Guttman M., Lander E.S., Getz G., Mesirov J.P. Integrative genomics viewer. Nat. Biotechnol. 2011;29:24–26. doi: 10.1038/nbt.1754. [DOI] [PMC free article] [PubMed] [Google Scholar]
- 22.McLaren W., Gil L., Hunt S.E., Riat H.S., Ritchie G.R.S., Thormann A., Flicek P., Cunningham F. The Ensembl Variant Effect Predictor. Genome Biol. 2016;17:122. doi: 10.1186/s13059-016-0974-4. [DOI] [PMC free article] [PubMed] [Google Scholar]
- 23.Mitsuhashi S., Frith M.C., Mizuguchi T., Miyatake S., Toyota T., Adachi H., Oma Y., Kino Y., Mitsuhashi H., Matsumoto N. Tandem-genotypes: robust detection of tandem repeat expansions from long DNA reads. Genome Biol. 2019;20:58. doi: 10.1186/s13059-019-1667-6. [DOI] [PMC free article] [PubMed] [Google Scholar]
- 24.van Swieten J.C., Brusse E., de Graaf B.M., Krieger E., van de Graaf R., de Koning I., Maat-Kievit A., Leegwater P., Dooijes D., Oostra B.A., Heutink P. A mutation in the fibroblast growth factor 14 gene is associated with autosomal dominant cerebellar ataxia [corrected] Am. J. Hum. Genet. 2003;72:191–199. doi: 10.1086/345488. [DOI] [PMC free article] [PubMed] [Google Scholar]
- 25.Zühlke C., Dalski A., Hellenbroich Y., Bubel S., Schwinger E., Bürk K. Spinocerebellar ataxia type 1 (SCA1): phenotype-genotype correlation studies in intermediate alleles. Eur. J. Hum. Genet. 2002;10:204–209. doi: 10.1038/sj.ejhg.5200788. [DOI] [PubMed] [Google Scholar]
- 26.Menon R.P., Nethisinghe S., Faggiano S., Vannocci T., Rezaei H., Pemble S., Sweeney M.G., Wood N.W., Davis M.B., Pastore A., Giunti P. The role of interruptions in polyQ in the pathology of SCA1. PLoS Genet. 2013;9:e1003648. doi: 10.1371/journal.pgen.1003648. [DOI] [PMC free article] [PubMed] [Google Scholar]
- 27.Pearson C.E., Eichler E.E., Lorenzetti D., Kramer S.F., Zoghbi H.Y., Nelson D.L., Sinden R.R. Interruptions in the triplet repeats of SCA1 and FRAXA reduce the propensity and complexity of slipped strand DNA (S-DNA) formation. Biochemistry. 1998;37:2701–2708. doi: 10.1021/bi972546c. [DOI] [PubMed] [Google Scholar]
- 28.Wang Q., McEwen D.G., Ornitz D.M. Subcellular and developmental expression of alternatively spliced forms of fibroblast growth factor 14. Mech. Dev. 2000;90:283–287. doi: 10.1016/s0925-4773(99)00241-5. [DOI] [PubMed] [Google Scholar]
- 29.Bidichandani S.I., Ashizawa T., Patel P.I. The GAA triplet-repeat expansion in Friedreich ataxia interferes with transcription and may be associated with an unusual DNA structure. Am. J. Hum. Genet. 1998;62:111–121. doi: 10.1086/301680. [DOI] [PMC free article] [PubMed] [Google Scholar]
- 30.Kuhlmann K., Cieselski M., Schumann J. Relative versus absolute RNA quantification: a comparative analysis based on the example of endothelial expression of vasoactive receptors. Biol. Proced. Online. 2021;23:6. doi: 10.1186/s12575-021-00144-w. [DOI] [PMC free article] [PubMed] [Google Scholar]
- 31.MacDougall H.G., Weber K.P., McGarvie L.A., Halmagyi G.M., Curthoys I.S. The video head impulse test: diagnostic accuracy in peripheral vestibulopathy. Neurology. 2009;73:1134–1141. doi: 10.1212/WNL.0b013e3181bacf85. [DOI] [PMC free article] [PubMed] [Google Scholar]
- 32.Szmulewicz D., MacDougall H., Storey E., Curthoys I., Halmagyi M. A novel quantitative bedside test of balance function: the video visually enhanced vestibulo-ocular reflex (VVOR) Neurology. 2014;82:S19–S1002. [Google Scholar]
- 33.Paulson H. Repeat expansion diseases. Handb. Clin. Neurol. 2018;147:105–123. doi: 10.1016/B978-0-444-63233-3.00009-9. [DOI] [PMC free article] [PubMed] [Google Scholar]
- 34.Ibañez K., Polke J., Hagelstrom R.T., Dolzhenko E., Pasko D., Thomas E.R.A., Daugherty L.C., Kasperaviciute D., Smith K.R., et al. WGS for Neurological Diseases Group Whole genome sequencing for the diagnosis of neurological repeat expansion disorders in the UK: a retrospective diagnostic accuracy and prospective clinical validation study. Lancet Neurol. 2022;21:234–245. doi: 10.1016/S1474-4422(21)00462-2. [DOI] [PMC free article] [PubMed] [Google Scholar]
- 35.Strupp M., Maul S., Konte B., Hartmann A.M., Giegling I., Wollenteit S., Feil K., Rujescu D. A variation in FGF14 is associated with downbeat nystagmus in a genome-wide association study. Cerebellum. 2020;19:348–357. doi: 10.1007/s12311-020-01113-x. [DOI] [PMC free article] [PubMed] [Google Scholar]
- 36.Wagner J.N., Glaser M., Brandt T., Strupp M. Downbeat nystagmus: aetiology and comorbidity in 117 patients. J. Neurol. Neurosurg. Psychiatry. 2008;79:672–677. doi: 10.1136/jnnp.2007.126284. [DOI] [PubMed] [Google Scholar]
- 37.Lou J.Y., Laezza F., Gerber B.R., Xiao M., Yamada K.A., Hartmann H., Craig A.M., Nerbonne J.M., Ornitz D.M. Fibroblast growth factor 14 is an intracellular modulator of voltage-gated sodium channels. J. Physiol. 2005;569:179–193. doi: 10.1113/jphysiol.2005.097220. [DOI] [PMC free article] [PubMed] [Google Scholar]
- 38.Di Re J., Wadsworth P.A., Laezza F. Intracellular fibroblast growth factor 14: emerging risk factor for brain disorders. Front. Cell. Neurosci. 2017;11:103. doi: 10.3389/fncel.2017.00103. [DOI] [PMC free article] [PubMed] [Google Scholar]
- 39.Wang Q., Bardgett M.E., Wong M., Wozniak D.F., Lou J., McNeil B.D., Chen C., Nardi A., Reid D.C., Yamada K., Ornitz D.M. Ataxia and paroxysmal dyskinesia in mice lacking axonally transported FGF14. Neuron. 2002;35:25–38. doi: 10.1016/s0896-6273(02)00744-4. [DOI] [PubMed] [Google Scholar]
- 40.Bosch M.K., Carrasquillo Y., Ransdell J.L., Kanakamedala A., Ornitz D.M., Nerbonne J.M. Intracellular FGF14 (iFGF14) is required for spontaneous and evoked firing in cerebellar purkinje neurons and for motor coordination and balance. J. Neurosci. 2015;35:6752–6769. doi: 10.1523/JNEUROSCI.2663-14.2015. [DOI] [PMC free article] [PubMed] [Google Scholar]
- 41.Yan H., Pablo J.L., Wang C., Pitt G.S. FGF14 modulates resurgent sodium current in mouse cerebellar Purkinje neurons. Elife. 2014;3:e04193. doi: 10.7554/eLife.04193. [DOI] [PMC free article] [PubMed] [Google Scholar]
- 42.Sakamoto N., Larson J.E., Iyer R.R., Montermini L., Pandolfo M., Wells R.D. GGA∗TCC-interrupted triplets in long GAA∗TTC repeats inhibit the formation of triplex and sticky DNA structures, alleviate transcription inhibition, and reduce genetic instabilities. J. Biol. Chem. 2001;276:27178–27187. doi: 10.1074/jbc.M101852200. [DOI] [PubMed] [Google Scholar]
- 43.Misceo D., Fannemel M., Barøy T., Roberto R., Tvedt B., Jaeger T., Bryn V., Strømme P., Frengen E. SCA27 caused by a chromosome translocation: further delineation of the phenotype. Neurogenetics. 2009;10:371–374. doi: 10.1007/s10048-009-0197-x. [DOI] [PubMed] [Google Scholar]
- 44.Groth C.L., Berman B.D. Spinocerebellar ataxia 27: a review and characterization of an evolving phenotype. Tremor Other Hyperkinet. Mov. 2018;8:534. doi: 10.7916/D80S0ZJQ. [DOI] [PMC free article] [PubMed] [Google Scholar]
- 45.Dalski A., Atici J., Kreuz F.R., Hellenbroich Y., Schwinger E., Zühlke C. Mutation analysis in the fibroblast growth factor 14 gene: frameshift mutation and polymorphisms in patients with inherited ataxias. Eur. J. Hum. Genet. 2005;13:118–120. doi: 10.1038/sj.ejhg.5201286. [DOI] [PubMed] [Google Scholar]
- 46.Miura S., Kosaka K., Fujioka R., Uchiyama Y., Shimojo T., Morikawa T., Irie A., Taniwaki T., Shibata H. Spinocerebellar ataxia 27 with a novel nonsense variant (Lys177X) in FGF14. Eur. J. Med. Genet. 2019;62:172–176. doi: 10.1016/j.ejmg.2018.07.005. [DOI] [PubMed] [Google Scholar]
- 47.Paucar M., Lundin J., Alshammari T., Bergendal Å., Lindefeldt M., Alshammari M., Solders G., Di Re J., Savitcheva I., Granberg T., et al. Broader phenotypic traits and widespread brain hypometabolism in spinocerebellar ataxia 27. J. Intern. Med. 2020;288:103–115. doi: 10.1111/joim.13052. [DOI] [PMC free article] [PubMed] [Google Scholar]
- 48.Casey H.L., Gomez C.M. Spinocerebellar ataxia type 6. GeneReviews. 1993 https://www.ncbi.nlm.nih.gov/books/NBK1140/ [Google Scholar]
- 49.Gisatulin M., Dobricic V., Zühlke C., Hellenbroich Y., Tadic V., Münchau A., Isenhardt K., Bürk K., Bahlo M., Lockhart P.J., et al. Clinical spectrum of the pentanucleotide repeat expansion in the RFC1 gene in ataxia syndromes. Neurology. 2020;95:e2912–e2923. doi: 10.1212/WNL.0000000000010744. [DOI] [PubMed] [Google Scholar]
- 50.Montaut S., Diedhiou N., Fahrer P., Marelli C., Lhermitte B., Robelin L., Vincent M.C., Corti L., Taieb G., Gebus O., et al. Biallelic RFC1-expansion in a French multicentric sporadic ataxia cohort. J. Neurol. 2021;268:3337–3343. doi: 10.1007/s00415-021-10499-5. [DOI] [PubMed] [Google Scholar]
- 51.Davies K., Szmulewicz D.J., Corben L.A., Delatycki M., Lockhart P.J. RFC1-related disease: molecular and clinical insights. Neurol. Genet. 2022;8:e200016. doi: 10.1212/NXG.0000000000200016. [DOI] [PMC free article] [PubMed] [Google Scholar]
- 52.Tezenas du Montcel S., Durr A., Bauer P., Figueroa K.P., Ichikawa Y., Brussino A., Forlani S., Rakowicz M., Schöls L., Mariotti C., et al. Modulation of the age at onset in spinocerebellar ataxia by CAG tracts in various genes. Brain. 2014;137:2444–2455. doi: 10.1093/brain/awu174. [DOI] [PMC free article] [PubMed] [Google Scholar]
- 53.Delatycki M.B., Williamson R., Forrest S.M. Friedreich ataxia: an overview. J. Med. Genet. 2000;37:1–8. doi: 10.1136/jmg.37.1.1. [DOI] [PMC free article] [PubMed] [Google Scholar]
- 54.Lange L.M., Gonzalez-Latapi P., Rajalingam R., Tijssen M.A.J., Ebrahimi-Fakhari D., Gabbert C., Ganos C., Ghosh R., Kumar K.R., Lang A.E., et al. Nomenclature of genetic movement disorders: recommendations of the international parkinson and movement disorder society task force - an update. Mov. Disord. 2022;37:905–935. doi: 10.1002/mds.28982. [DOI] [PubMed] [Google Scholar]
- 55.Marras C., Lang A., van de Warrenburg B.P., Sue C.M., Tabrizi S.J., Bertram L., Mercimek-Mahmutoglu S., Ebrahimi-Fakhari D., Warner T.T., Durr A., et al. Nomenclature of genetic movement disorders: Recommendations of the international Parkinson and movement disorder society task force. Mov. Disord. 2016;31:436–457. doi: 10.1002/mds.26527. [DOI] [PubMed] [Google Scholar]
- 56.Lockhart P.J. Advancing the diagnosis of repeat expansion disorders. Lancet Neurol. 2022;21:205–207. doi: 10.1016/S1474-4422(22)00033-3. [DOI] [PubMed] [Google Scholar]
Associated Data
This section collects any data citations, data availability statements, or supplementary materials included in this article.
Supplementary Materials
Data Availability Statement
The accession for the FGF14 variants reported in this paper is ClinVar: SCV002576522. The datasets and code supporting the current study are available at the links described in web resources. Sequencing data have not been deposited in a public repository due to restrictions associated with participant consent but are available from the corresponding author on reasonable and appropriate request.