
Fig. 2.
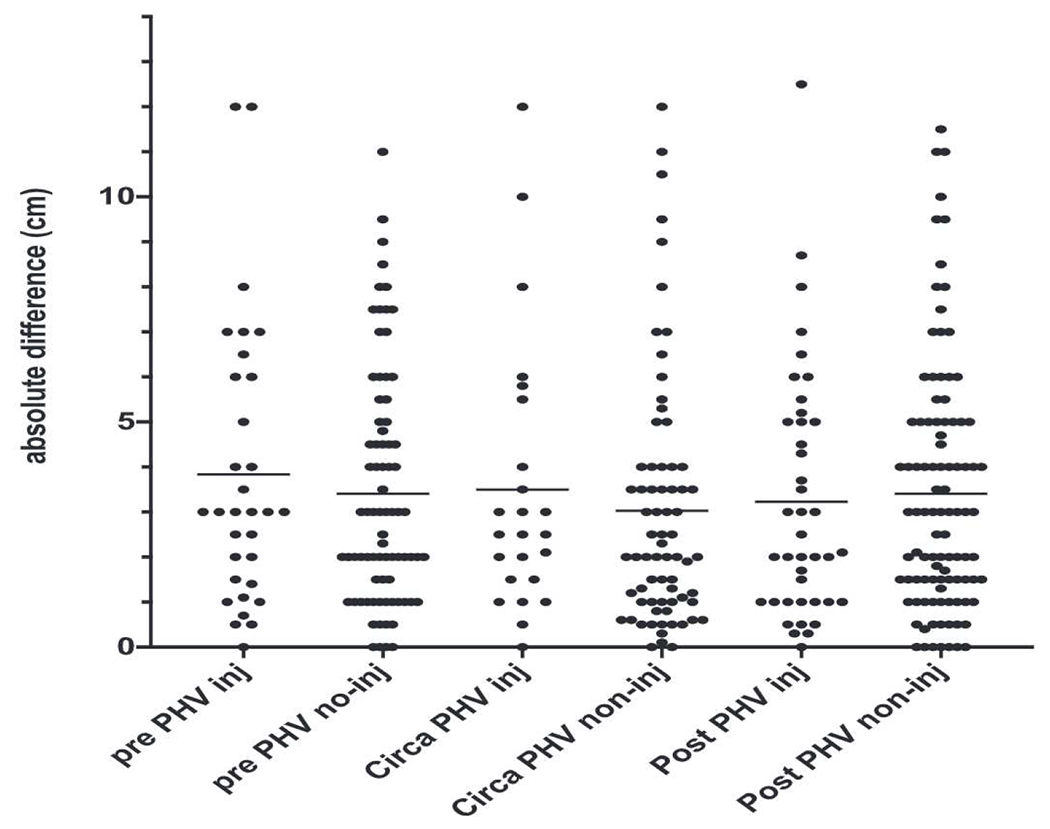
Distribution of inter-limb difference scores for prospectively injured and non-injured players in each maturity group. The mean scores is also displayed for each group by the marked line.
Official websites use .gov
A
.gov website belongs to an official
government organization in the United States.
Secure .gov websites use HTTPS
A lock (
) or https:// means you've safely
connected to the .gov website. Share sensitive
information only on official, secure websites.
Distribution of inter-limb difference scores for prospectively injured and non-injured players in each maturity group. The mean scores is also displayed for each group by the marked line.