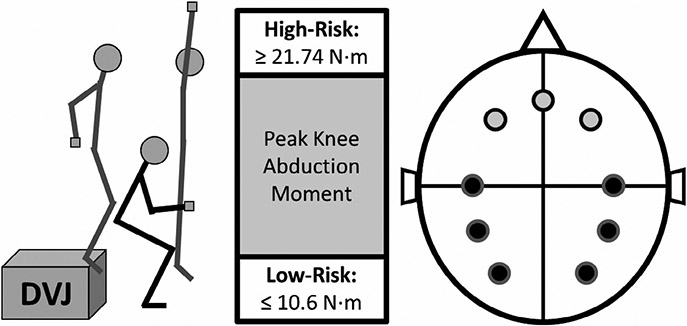
FIGURE 1.
The DVJ is shown in the left of the figure. The peak knee abduction moment is calculated at the position of the black stick figure. Based on that value, the participants were assigned to their respective groups using the cutoffs displayed in the middle panel. Finally, the electrode positions are displayed on the right side of the figure. The light gray circles indicate the locations of the frontal theta frequency band electrodes. In order from left to right they are F3, FZ, and F4. The black circles indicate the locations of the parietal, central, and occipital alpha-2 frequency band electrodes. Starting from the top-left midline electrode they are C3, P3, O1, O2, P4, and C4 in counterclockwise order

