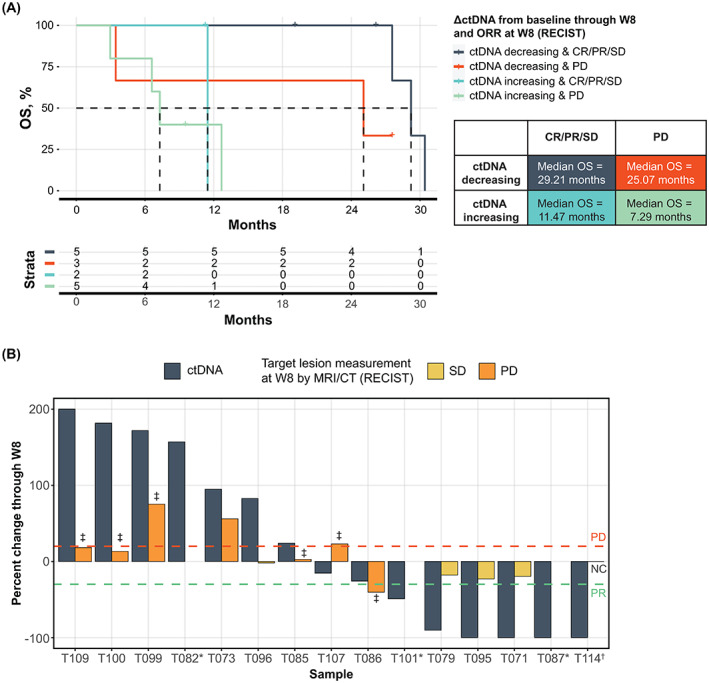
Fig. 3.

ctDNA response can stratify RECIST groups and identify patients with highly favorable survival. (A) Kaplan–Meier curve of OS for patients stratified by their ctDNA change through W8 and RECIST response at W8 for 15 patients with available baseline and on‐treatment ctDNA samples. (B) Waterfall plot of ctDNA change and RECIST response through W8. Three patients (T071, T087, T114) experienced ctDNA clearance by W8. *Patients T082, T101, and T087 did not have a target lesion available for RECIST assessment. †T114 had no change (NC) from baseline TL assessment. ‡Denotes appearance of new lesions. PD line at +20% and PR line at −30% change from baseline. ΔctDNA, change in circulating tumor DNA; CR, complete response; CT, computed tomography; ctDNA, circulating tumor DNA; ORR, overall response rate; OS, overall survival; PD, progressive disease; PR, partial response; RECIST, Response Evaluation Criteria in Solid Tumors; SD, stable disease; W8, week 8.
