
Fig. 4.
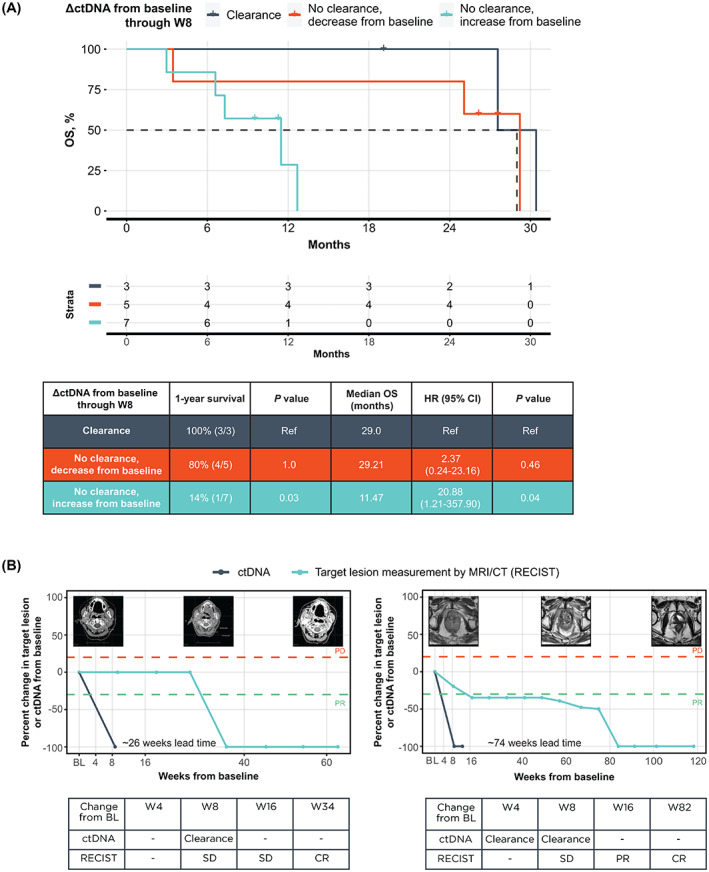
ctDNA clearance identifies patients with highly favorable survival. (A) Kaplan–Meier curve of OS for patients stratified by clearance and change in ctDNA from baseline through W8. (B) Two patients had ctDNA clearance followed by a complete RECIST response. ΔctDNA, change in circulating tumor DNA; BL, baseline; CI, confidence interval; CR, complete response; CT, computed tomography; ctDNA, circulating tumor DNA; OS, overall survival; PD, progressive disease; PR, partial response; RECIST, Response Evaluation Criteria in Solid Tumors; ref, reference; SD, stable disease; W4, week 4; W8, week 8; W16, week 16; W82, week 82.