. 2023 Feb 2;13(7):4222–4235. doi: 10.1039/d2ra07972k

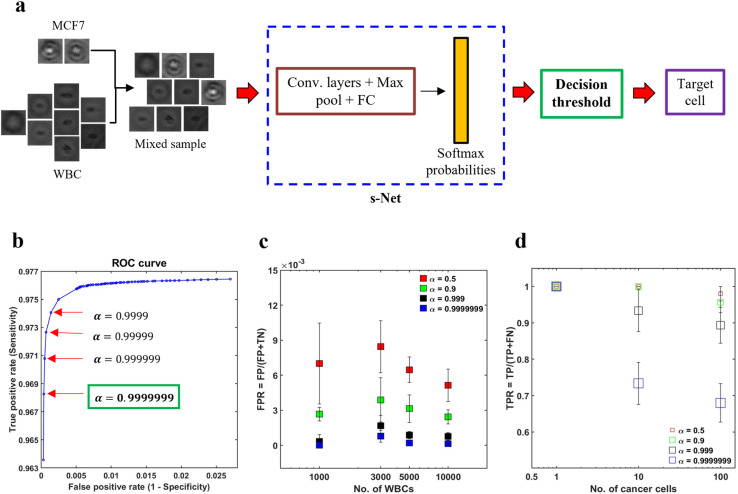
Fig. 5. Reducing the false positives (FPs) using decision thresholding. (a) Schematic illustrating the application of decision thresholding for cancer cell classification; (b) selection of optimal threshold using receiver operator characteristic (ROC) analysis. A stringent threshold (α) of 0.9999999 is selected as it yielded the minimum FPR without any further change; (c) to demonstrate the applicability of the selected threshold in reducing the FPR, four artificially mixed samples were generated in silico. In these datasets, the number of MCF-7 cancer cells (NMCF−7) was kept constant at 100, while the number of WBCs (NWBC) was varied from 1000–10 000. It was ensured that no overlap between the two cell types existed across the four datasets. For increasing WBC counts, the FPR is plotted for 4 values of α: 0.5 (red), 0.9 (green), 0.999 (black) and 0.9999999 (blue). Error bars indicate the standard deviation of three trials (n = 3); (d) effect of α on the TPR is shown. In these trials, three datasets were generated, wherein, NWBC was fixed at 5000 and NMCF−7 was varied from 1–100. Error bars indicate the standard deviation of three trials (n = 3).

Fig. 5