
FIG. 2.

Experimentally determined and predicted steady-state glucose concentrations for E. coli ML 30 in glucose-controlled chemostat cultures at 17.4, 28.4, 37, and 40°C, as a function of dilution (growth) rate. Bars indicate the steady-state substrate concentrations (indicating vertically the standard deviation of the steady-state glucose concentrations determined as a mean of about 10 measurements and horizontally the approximate variation in D); lines indicate predictions of steady-state glucose concentrations by different models (adapted from reference 34) as follows: 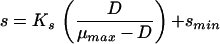 (34),
(34), 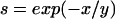 (266),
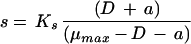 (195), and
 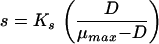 (166).