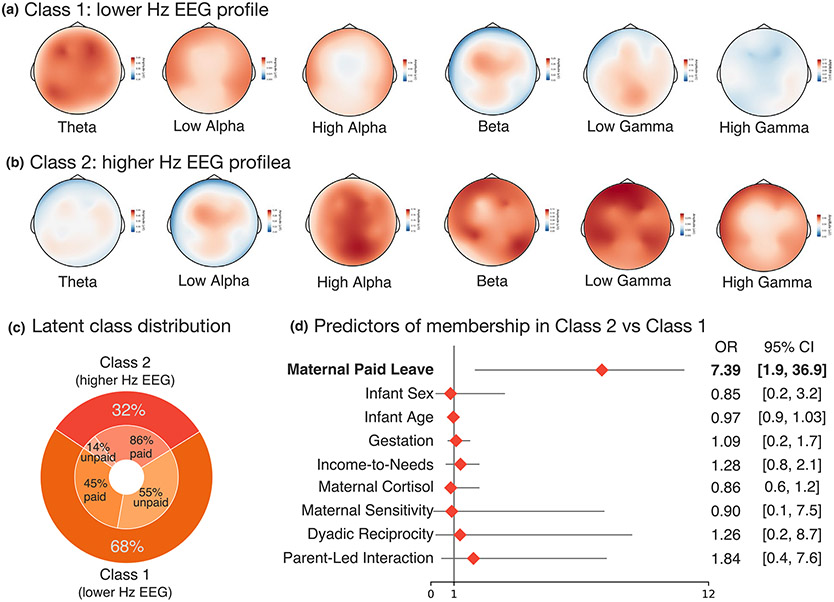
FIGURE 2.
Two profile model of electroencephalography (EEG) relative activation patterns. (a) Class 1 had higher relative EEG power across low frequency bands (theta). (b) Class 2 was characterized by increased relative EEG power across higher frequency bands, a profile typically reflecting greater maturational development. (c) Classification of infants based on most-likely profile membership. (d) Mothers with paid leave were over 7 times as likely to have infants classified in the higher Hz EEG profile. No other variables predicted profile membership

