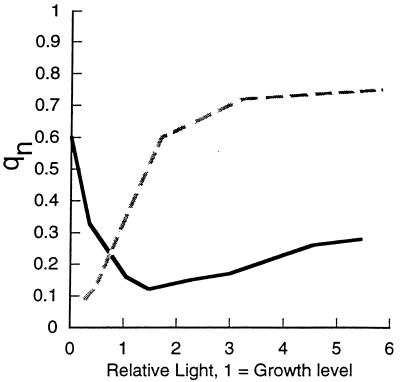
FIG. 7.
Nonphotochemical quenching of fluorescence plotted against light. Typical light response curves of nonphotochemical quenching in a cyanobacterium, Synechococcus sp. strain PCC 7942 (solid line), and in rye for a plant-type pattern (dotted line) are shown. For comparison, light intensity is expressed relative to the growth light intensity; 1 = growth level. The actual growth light intensities were 50 μmol of photons m−2 s−1 for the cyanobacterium and 250 μmol of photons m−2 s−1 for the rye.

