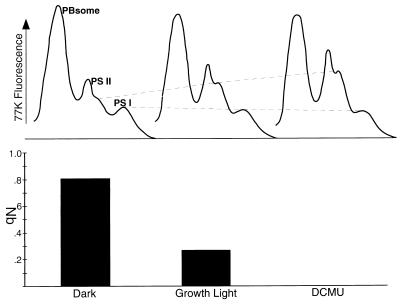
FIG. 9.
77K Fluorescence emission spectra show that changing qN reflects state transitions. The dashed lines emphasize increasing PS II fluorescence and decreasing PS I fluorescence in parallel with the drop in nonphotochemical quenching, measured in the same cultures. A Synechococcus sp. strain PCC 7942 culture sample was incubated in the PAM cuvette in darkness, under the growth light intensity (50 μmol of photons m−2 s−1), and after addition of DCMU under continuing illumination. For each condition, qN was measured and a small sample was taken for 77K fluorescence emission spectral analysis. Excitation of 77K fluorescence was carried out with 574 nm light absorbed by the phycobilisome (PBsome). Fluorescence spectra are from samples of equal chlorophyll content but are not otherwise normalized.

