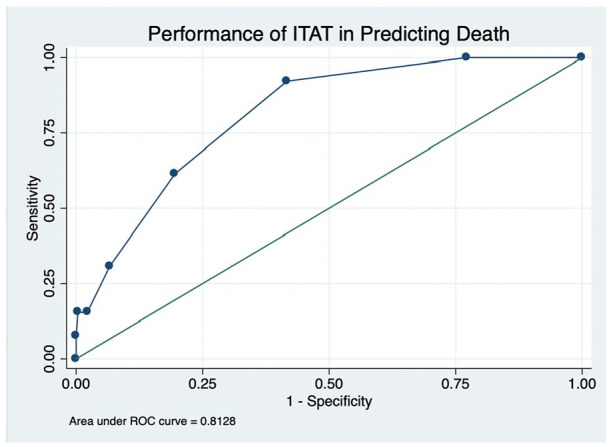
Figure 2.

The ROC curve for the ITAT score
At an ITAT cutoff value of 4, the sensitivity, specificity, and likelihood ratio were 31%, 94%, and 5.0, respectively. The positive and negative predictive values were 0.29 and 0.95, respectively.

The ROC curve for the ITAT score
At an ITAT cutoff value of 4, the sensitivity, specificity, and likelihood ratio were 31%, 94%, and 5.0, respectively. The positive and negative predictive values were 0.29 and 0.95, respectively.