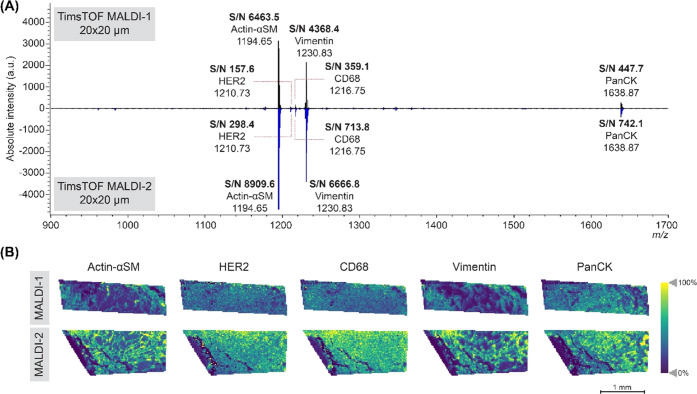
Figure 4.
TimsTOF MALDI-1 vs MALDI-2 on breast cancer tissue samples from patient 1 with the PC-MTs. (A) Spectra of timsTOF MALDI-1 (top, black) and timsTOF MALDI-2 (bottom, blue) at 20 × 20 μm. The S/N of the mass-tags was increased in the MALDI-2 measurement compared to the MALDI-1 data. (B) Single-ion images of five peptide mass reporters detected, which were actin-αSM, HER2, CD68, vimentin, and panCK, respectively. The MALDI-2 data showed an increased intensity and better observable spatial details compared to the MALDI-1 data.

