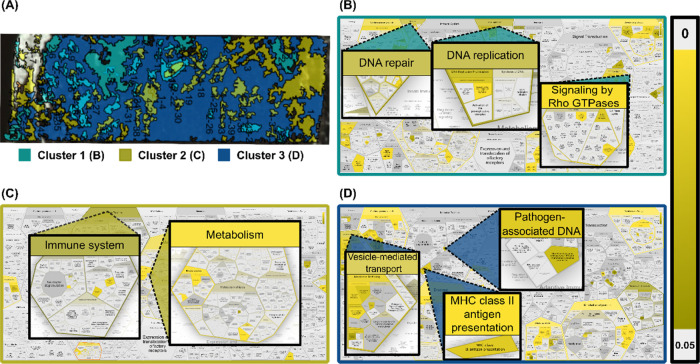
Figure 5.
Cluster-specific pathway analysis of over-represented proteins from LMD LC-MS of 0.5 mm2 tissue of patient 1. (A) Overview of intensity clusters based on MALDI-IHC images. (B–D) Highlighted pathways correlating with over-represented proteins identified exclusively in cluster 1 to cluster 3, respectively. Scale bar = statistical significance of each hit pathway for the sample reflected in color gradient (p-value).

