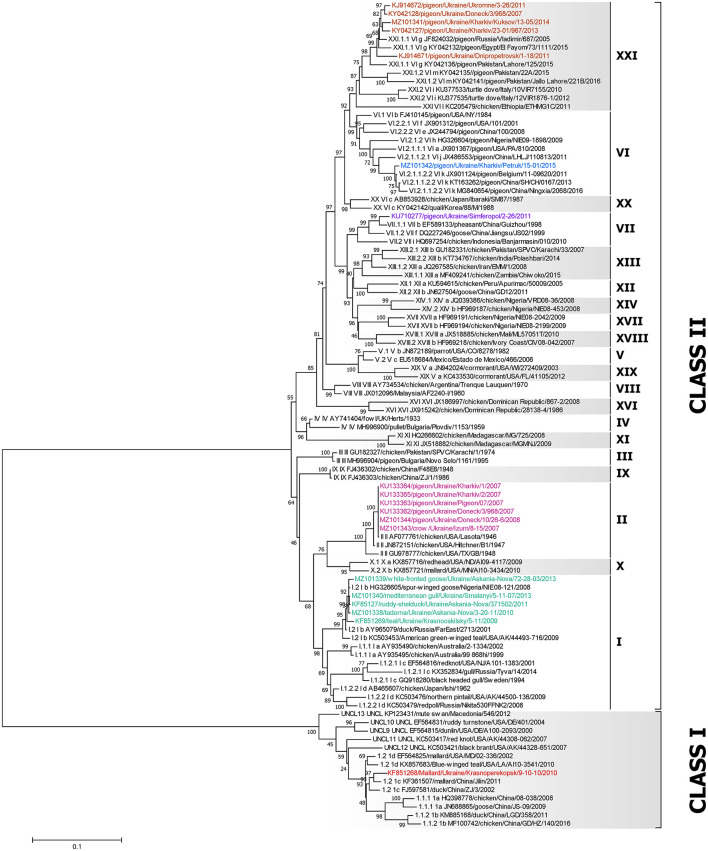
Figure 2.
Phylogenetic analysis of NDV class I and II isolates based on the complete fusion gene sequences constructed with the maximum likelihood method, based on the general time-reversible model in MEGA v. 7.0.26. The percentage of trees in which the associated taxa clustered together in the bootstrap test (1,000 replicates) is shown next to the branches. The analysis involved 98 nucleotide sequences, 79 represent all class I and II sub-genotypes described by Dimitrov et al. (5) and 19 were collected from wild and synanthropic birds in Ukraine. All positions containing gaps and missing data were eliminated. There were a total of 1,661 positions in the final data set. The isolates used in this study are shown in colors. The Roman numerals presented in the taxa names in the phylogenetic tree represent the respective sub-genotype for each isolate, followed by the GenBank identification number, host name, country of isolation, strain designation, and year of isolation (if available).

