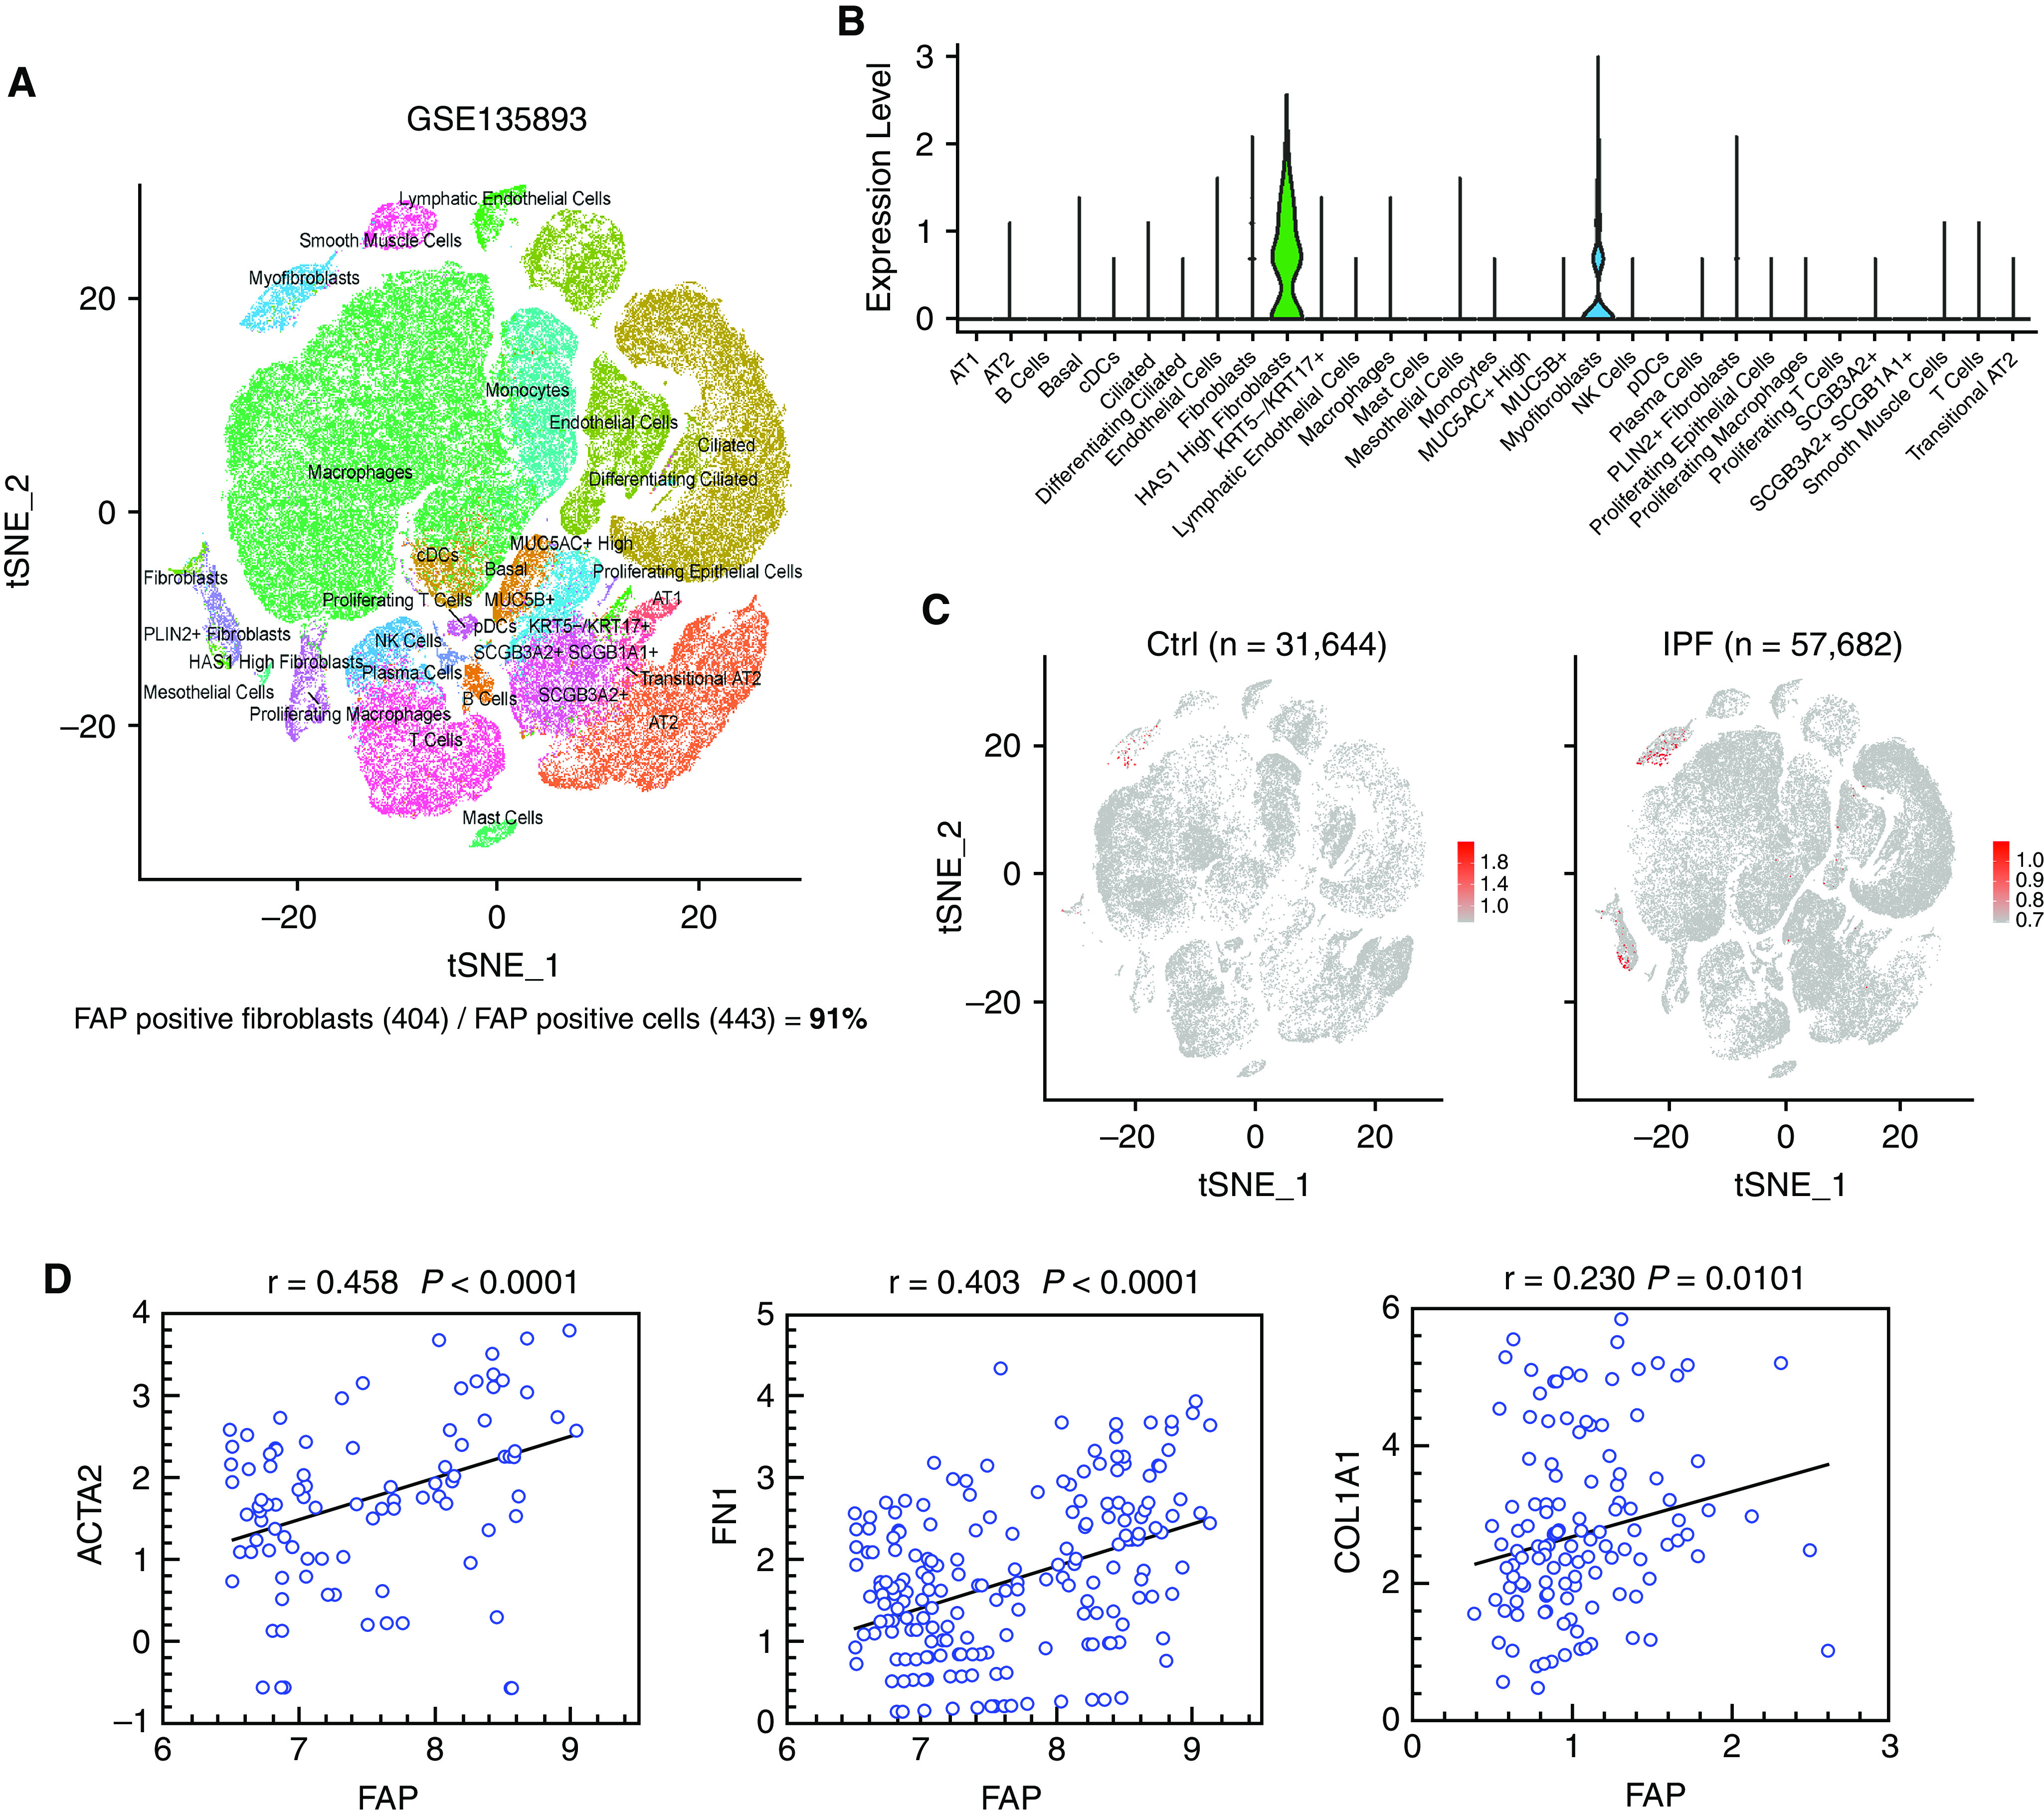
Figure 3.

Single-cell analysis reveals the specific expression of fibroblast activation protein (FAP) in fibroblasts from the public data. (A) Uniform manifold approximation and projection (UMAP) shows the control and idiopathic pulmonary fibrosis (IPF) single-cell populations from study GSE135893. (B) FAP expression level in each cell population using single-cell RNA sequencing data from study GSE135893. (C) UMAP shows the cells that express FAP in healthy donors and patients with IPF from study GSE135893. (D) Expression correlation analysis between FAP and ACTA2, FN1, and COL1A1 (the x-axis and y-axis represent log2 normalized expression level). cDCs = conventional dendritic cells; Ctrl = control; NK = natural killer; tSNE = t-distributed stochastic neighbor embedding.
