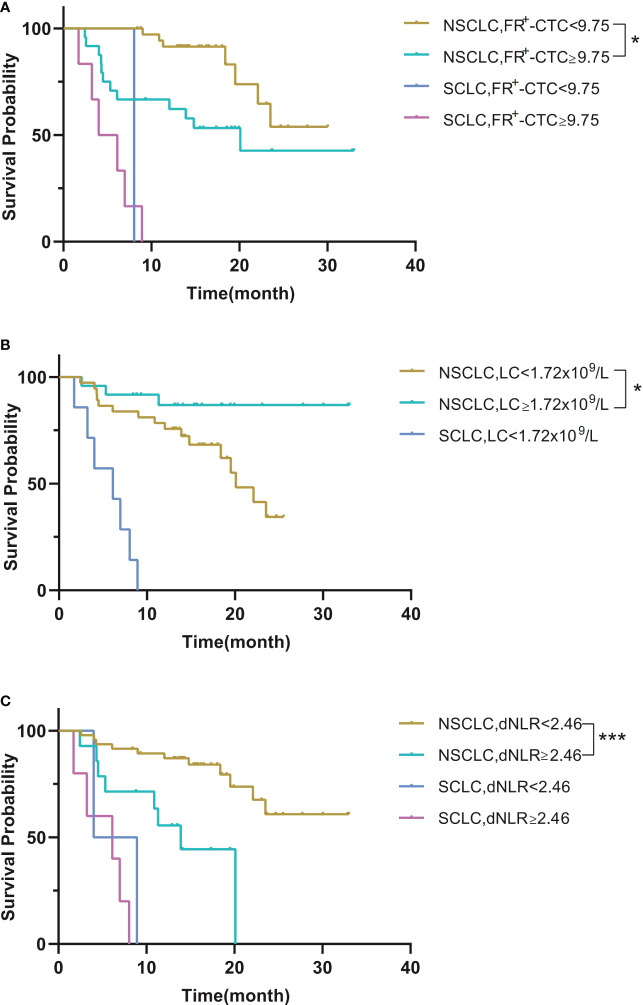
Figure 2.
(A) Kaplan–Meier curves for survival probability according to the FR+-CTC count between NSCLC and SCLC. (B) Kaplan–Meier curves for survival probability according to the LC between NSCLC and SCLC. (C) Kaplan–Meier curves for survival probability according to the dNLR between NSCLC and SCLC. *P < 0.05, **P < 0.01, ***P < 0.001.

