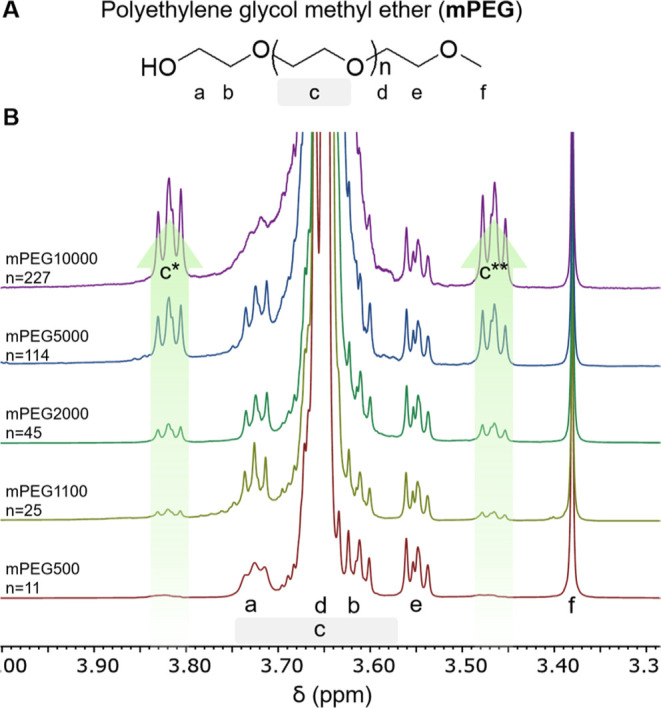
Figure 2.

mPEG by MW (A). Chemical structure of mPEG with end groups and main polymer block protons labeled for reference. (B). 1H NMR spectra (400 MHz, CDCl3) normalized to tetramethyl silane stack of mPEGs with MW from 500 to 10000 Da. The integration of the 1H – 13C coupling peaks c* (δ = 3.82 ppm) and c** (δ = 3.47 ppm) increase with MW but resolution of peaks a and b from peak c decrease.
