Figure 1.
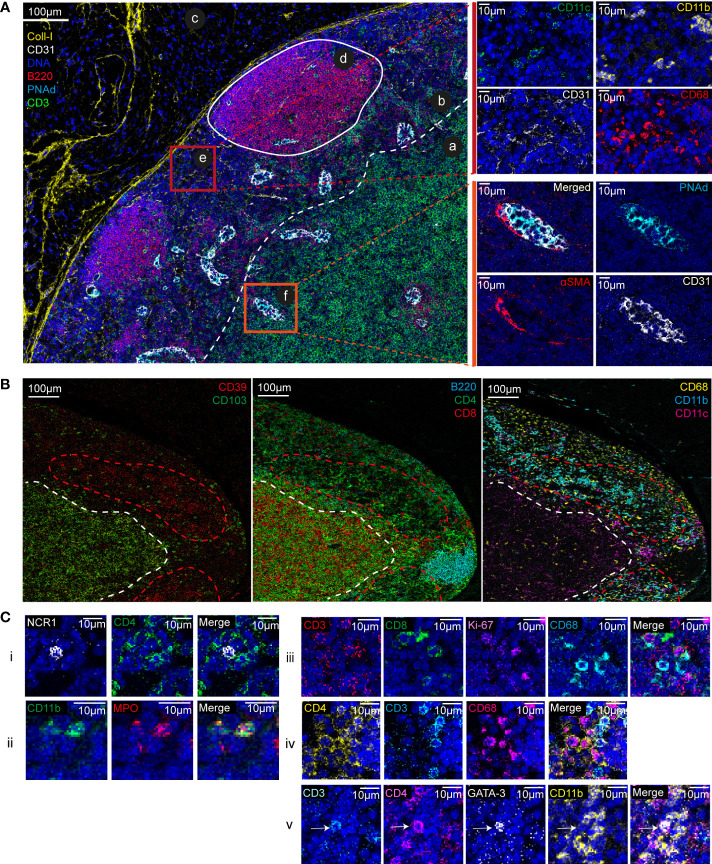
Lymph node anatomy, cell composition, and cell localization revealed by IMC. (A) Multiplexed pseudo-colored images showing the lymph node architecture: (a) cortex, (b) paracortex, (c) capsule, (d) germinal center, (e) cortical sinus, and (f) high endothelial venule. The white dashed line separates the paracortex from the cortex. Upper zoom (red square): cell composition of the cortical sinus (e) assessed by CD11c, CD11b, CD31 and CD68 signal analysis. Insets (orange square): high endothelial venule identified by PNAd, CD31, and αSMA expression. (B) Multiplexed pseudo-colored images showing the CD103- and CD39-positive areas. Green and red dashed lines delimit the CD103- and CD39-positive areas, respectively. Lymphoid areas are identified by B220, CD4, and CD8 expression. Myeloid areas are identified by CD11b, CD11c and CD68 expression. (C) Single-cell analysis and cell interactions: (i) NK cell (NCR-1+), (ii) neutrophil (CD11b+MPO+), (iii) two proliferating CD8+ T cells (CD8+Ki-67+) and a macrophage (CD68+), (iv) discrimination between CD4+ T cells (CD3+CD4+CD68-) and CD4+ macrophages (CD68+CD4+CD3-), and (v) a Th2 T cell (CD3+CD4+GATA-3+) in contact with a myeloid cells (CD11b+).

