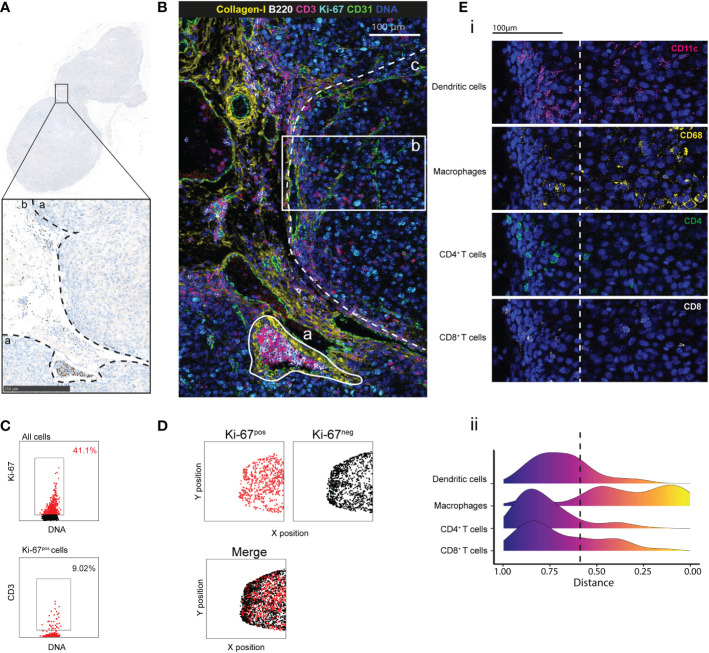
Figure 2.
Cell distribution and tumor microenvironment characterization by IMC. (A) IHC staining with PAX-5 (brown) and hematoxylin (blue) of a region of interest (ROI) in a B16-K1 melanoma cell graft tissue section. The black dashed lines delimitate the tumor (a) and the peritumoral (b) areas. (B) Pseudo-colored image of the ROI. Overlaid signals of collagen I (extracellular matrix), B220 (B cells), CD3 (T cells), CD31 (endothelial cells), Ki-67 (proliferation) and DNA (nucleus). The white lines delimit: (a) a lymphatic vessel, and (b) a tumor area from the tumor core to the periphery. The white dashed line demarcates the main tumor area (c). (C) Proliferating cells and T cells identified by manual gating. (3). (D) Distribution of Ki-67-positive (red) and Ki-67-negative (black) cells in the main tumor area, assessed as in (C). (E) (i) T-cell exclusion in the tumor core within the tumor area (2) in (B) confirmed by the CD11c (dendritic cells), CD68 (macrophages), CD4 (CD4+ T cells) and CD8 (CD8+ T cells) signals. (ii) Distribution of dendritic cells, macrophages, CD4+ and CD8+ T cells in the tumor. For each cell, its distance from the tumor core was calculated. The color scale indicates the distance from the core. The dashed line represents the border between tumor core and periphery.

