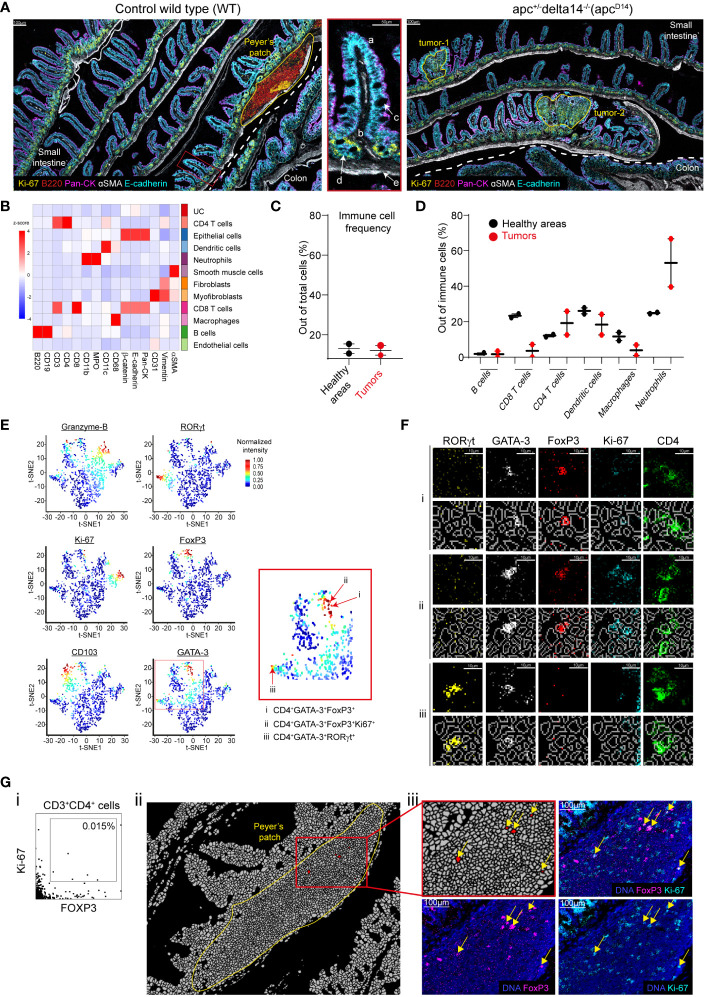
Figure 3.
Single-cell analysis and validation. (A) Pseudo-colored images of gut sections from a WT and Apc Δ14+ mouse. The dashed white line separates small intestine and colon. The areas of interest (the Peyer’s patch and two tumors) are delineated by yellow lines. The zoomed inset (middle panel) represents a villus (a) with the lamina propria (b), goblet cells (c), crypts (d), and muscularis mucosae (e) in the WT small intestine. (B) Heatmap showing the z-score of the expression of the indicated markers in the 11 cell clusters generated by Phenograph after cell segmentation of the WT and Apc Δ14+ images. UC: unidentified cluster. (C) Immune cell frequencies in the two healthy zones H Apc and HWT (black dots), and in the two tumors (red dots). Immune cells were defined using the clusters identified in (B). The Peyer’s patch was excluded from the analysis. (D) Percentage of each immune cell cluster identified in (B) among all immune cells present in two healthy area H Apc and HWT (black dots) and the two tumors (red dots). (E) t-SNE representation of the expression of functional markers in the CD4+ T-cell cluster identified in (B). Red arrows in the red square shows CD4+ T cells expressing multiple functional markers. (F) Validation of the functional marker expression on cells identified in (E): i: CD4+FOXP3+GATA-3+, ii: CD4+FOXP3+GATA-3+Ki-67+. iii: CD4+FOXP3+RORγt+ cells. For each cell phenotype, upper lines represent single marker expression and bottom lines show the single marker expression combined with the segmentation mask. (G) (i) Manual gating identified CD3+CD4+FOXP3+Ki-67+ cells. (ii) Localization of the cells identified in (G, i). The image corresponds to the segmentation mask of the Peyer’s patch and the red cluster corresponds to CD3+CD4+FOXP3+Ki-67+ cells. (iii) Validation of the expression of FOXP3 and Ki-67 in the cells identified in (G, i) using the raw images.

